1
$\begingroup$

A point source of light passing through a rectangular aperture causes a diffraction pattern that is a extension of a single single diffraction pattern (In that the pattern appears in 2 axes).

enter image description here

The pattern that is observed is as follows:

enter image description here

Is it possible to create a 3D plot for the intensity of light. With the origin at the center of the diffraction pattern, from the image.

Something like this.

enter image description here

I know how to create a 2D intensity graph for the case of single slit diffraction. But that is using Tracker and not Mathematica. How can I make this 3D plot using Mathematica?

Also I haven't done image processing of this kind with Mathematica before. Am I supposed to pre-edit the image in any way or just use the raw image from the camera?

Thanks for any and all help.

EDIT: Another question I just thought of. How can I extract the values for intensity for the maximas from the image?

$\endgroup$
4
  • 1
    $\begingroup$ Something like ListPlot3D[ImageData[RemoveAlphaChannel@ColorConvert[img,"Grayscale"]], PlotRange -> All, ColorFunction -> "Rainbow", DataRange -> {{-50, 50}, {-50, 50}}] might be a worthwhile start? $\endgroup$
    – Carl Lange
    Commented Mar 5, 2021 at 13:42
  • $\begingroup$ This is really good. Do you know how I can get the intensity values for the maximas. I'm not sure how to extract it from the image. $\endgroup$ Commented Mar 6, 2021 at 7:20
  • 1
    $\begingroup$ You should linearize colorspace in order to get real physical intencity values. More info: "The correct way to linearize colorspace before resizing, blurring etc", also see the "UPDATE" section of this answer. $\endgroup$ Commented Mar 7, 2021 at 12:57
  • $\begingroup$ Thanks I will read this sounds interesting. $\endgroup$ Commented Mar 8, 2021 at 3:45

3 Answers 3

2
$\begingroup$
image = Import["https://i.sstatic.net/3O5xI.png"];

intensity = First @ Values @ ComponentMeasurements[image, "IntensityData"]; 

intensityarray = ArrayReshape[intensity, Reverse @ ImageDimensions @ image];

ListPlot3D[intensityarray, ColorFunction -> "Rainbow", PlotRange -> All]

enter image description here

"IntensityData" seems to be the same as GrayLevel value when we remove the alpha channel from the input image and ColorConvert the image to GrayLevel:

intensityarrayb = ImageData[ColorConvert[RemoveAlphaChannel@image, GrayLevel]]; 

intensityarray == intensityarrayb
True
$\endgroup$
2
  • $\begingroup$ Thanks this is great! Do you know how I can get the values of intensity for each of the maixmas from that image. Also what is the unit for this intensity. I've tried searching online I can't seem to find it. $\endgroup$ Commented Mar 6, 2021 at 8:45
  • $\begingroup$ @BhorisDhanjal, "IntensityData" for a pixel seems to be gray level value (a value b/w 0 and 1). Yoy can use MaxDetect on intensityarray (e.g., MaxDetect[intensityarray, .1] //Colorize) to identify the local maximas. $\endgroup$
    – kglr
    Commented Mar 6, 2021 at 9:32
2
$\begingroup$

I took your grayscale pattern and did following:

a = ImageData@Import["https://i.sstatic.net/3O5xI.png"];
ListPlot3D[MovingAverage[b[[All, All, 1]], 6], 
 PlotRange -> {{10, 320}, {5, 320}, All}, 
 ColorFunction -> "Rainbow"]

enter image description here

The MovingAverage was used to make the background noise of your image a bit softer. The [[All,All,1]] after b were used because the initial image contains alfa-channel..

$\endgroup$
7
  • $\begingroup$ Does this give quantitative measurements? Any idea how I can extract out this information for the maxima values. $\endgroup$ Commented Mar 6, 2021 at 7:14
  • 1
    $\begingroup$ @BhorisDhanjal, I took your picture, man, and just have redrawn it in 3D as you ask. It is evidently not a correct physical data because zero order of diffraction is too weak . I guess, it is manually suppressed for nice view of the higher orders. You should solve the diffraction problem for your case to obtain the physically correct data about real amplitudes of orders. $\endgroup$
    – Rom38
    Commented Mar 6, 2021 at 8:58
  • $\begingroup$ Yup I'll do that thanks a lot for your help. $\endgroup$ Commented Mar 6, 2021 at 9:06
  • $\begingroup$ @BhorisDhanjal, actually, the simple model of diffraction for any hole can be done very easy - you just need to make a summation of complex amplitudes of spherical waves (that sit on the outer face of the slit) at the desired plane after the slit. $\endgroup$
    – Rom38
    Commented Mar 6, 2021 at 9:08
  • $\begingroup$ I have found the analytical formula for intensity of this case. Which was $I(x,y) \propto sinc^{2} \left ( \frac{\pi Wx}{\lambda z} \right ) sinc^{2} \left ( \frac{\pi Hy}{\lambda z} \right )$. However I was looking to try and verify it via observation as well. I think I can get those values for intensity using Tracker so it should be fine. $\endgroup$ Commented Mar 6, 2021 at 9:13
1
$\begingroup$

For quantitative measurements mentioned in comments of previois answers:

i = Import["https://i.sstatic.net/dYVTC.png"]

enter image description here

Not a great attempt at cleaning up the image:

i0 = Rasterize[RemoveBackground[RemoveBackground[ImageMultiply[i, MaxDetect[i, 0.6]]], Black],Background -> Black]

enter image description here

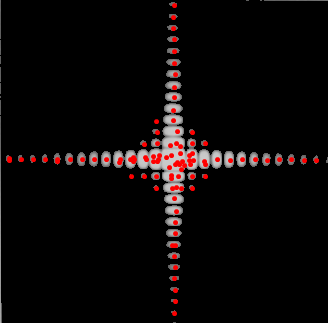
You can identify all the max intenisty points of each section:

markers = MaxDetect[i0, Padding -> 1];
HighlightImage[i0, markers, Method -> {"DiskMarkers", 5}]

enter image description here

Measure the max intesity of each segment:

ComponentMeasurements[i0, "MaxIntensity"]

If you explore ComponentMeasurements[] there is a bunch of nice stuff you can measure and plot.

out[1]: {1 -> 0.407843, 2 -> 0.372549, 3 -> 0.380392,...}

Stealing Rom38's 3D code:

a = ImageData@i0;
ListPlot3D[MovingAverage[a[[All, All, 1]], 6], 
 PlotRange -> {{10, 320}, {5, 320}, All}, ColorFunction -> "Rainbow"]

enter image description here

I think you can use a median filter like this, if you would like a smoother graph as in your original post

Smoothing the Sharp Undesired Points in ListPlot3D

$\endgroup$
1
  • $\begingroup$ Thanks this is really good. $\endgroup$ Commented Mar 8, 2021 at 6:22

Your Answer

By clicking “Post Your Answer”, you agree to our terms of service and acknowledge you have read our privacy policy.

Not the answer you're looking for? Browse other questions tagged or ask your own question.