7
$\begingroup$

Bug introduced in 11.3 or earlier and persisting through 13.3.0

@Szabolcs reported this bug on the WRI Redmine bug tracker 11 months ago. It is still "In Progress".


Epilog in DateHistogram is incorrectly rendered.

$Version
(* "12.2.0 for Mac OS X x86 (64-bit) (December 12, 2020)" *)    

dates = {DateObject[{2021, 01, 10}], DateObject[{2021, 01, 10}], DateObject[{2021, 01, 12}]}

epilog = Inset[Framed[Grid[{{"Mean", 1.5}}, Alignment -> {{Left, Right}}]], Scaled[{1, 1}], ImageScaled[{1, 1}]];

The epilog looks fine

Graphics@epilog

enter image description here

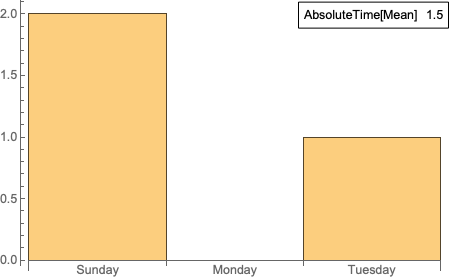
When it is used in DateHistogram, AbsoluteTime is evaluated on the text.

DateHistogram[dates, "Day", Epilog -> epilog]

enter image description here

Reproducible on Wolfram Cloud "12.2.0 for Linux x86 (64-bit) (November 16, 2020)"

This only happens with DateHistogram, it works fine with Histogram. I could find nothing in the documentation regarding the special behavior of Epilog in DateHistogram.

Is this a bug? Any workarounds?

$\endgroup$
0

1 Answer 1

8
$\begingroup$

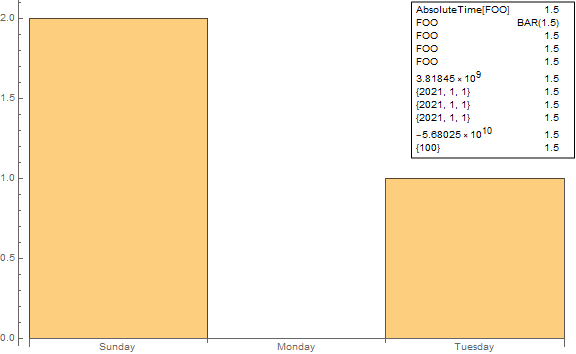
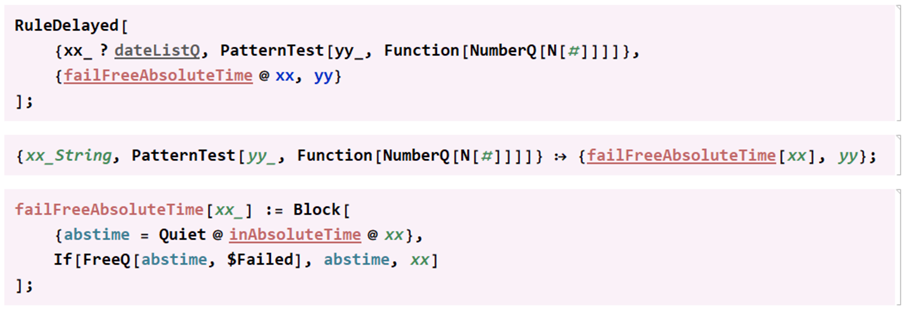
This is certainly a bug: All pairs {a:(_String|_List), b_?(NumberQ[N@#]&)} that appear anywhere in epilog/prolog are replaced with {AbsoluteTime[a], b}.

An example that shows various cases that trigger the mysterious behavior as well as possible work-arounds:

epilog2 = Inset[Framed[
    Grid[{{"FOO", 1.5}, 
        {"FOO", BAR[1.5]},
        {"FOO", "1.5"}, 
        {Defer@"FOO", 1.5},
        {FOO, 1.5},
        {{2021, 1, 1}, 1.5}, 
        {{2021, 1, 1}, "1.5"},
        {{2021, 1, 1}, 1.5, ""},
        {Defer@{2021, 1, 1}, 1.5}
        {{100}, 1.5},
        {Defer@{100}, 1.5}}, 
   Alignment -> {{Left, Right}}]], Scaled[{1, 1}],  ImageScaled[{1, 1}]];

DateHistogram[dates, "Day", Epilog -> epilog2]

enter image description here

$Version
 "11.3.0 for Microsoft Windows (64-bit) (March 7, 2018)"

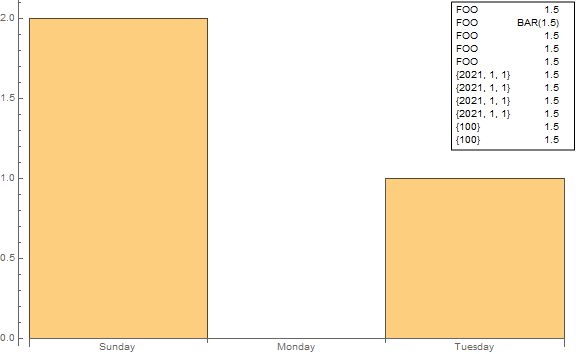
An alternative work-around is to remove the option Epilog from DateHistogram, wrap it with Show and add the epilog in Show:

Show[DateHistogram[dates, "Day",  ImageSize -> Large], Epilog -> epilog2]

or

Show[DateHistogram[dates, "Day",  ImageSize -> Large], Graphics@epilog2]

enter image description here

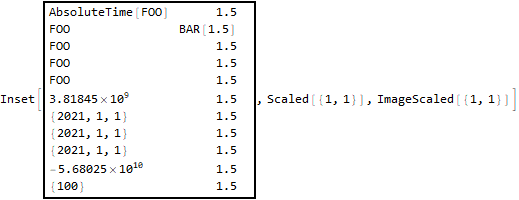
The culprit is the replacement rule Charting`timeCoordRule applied to epilog (also prolog and axes origin) expressions inside the function Charting`iDateHistogram:

epilog2 /. Charting`timeCoordRule

![enter image description here

Its definition:

GeneralUtilities`PrintDefinitionsLocal[Charting`timeCoordRule]

enter image description here

$\endgroup$

Your Answer

By clicking “Post Your Answer”, you agree to our terms of service and acknowledge you have read our privacy policy.

Not the answer you're looking for? Browse other questions tagged or ask your own question.