6
$\begingroup$

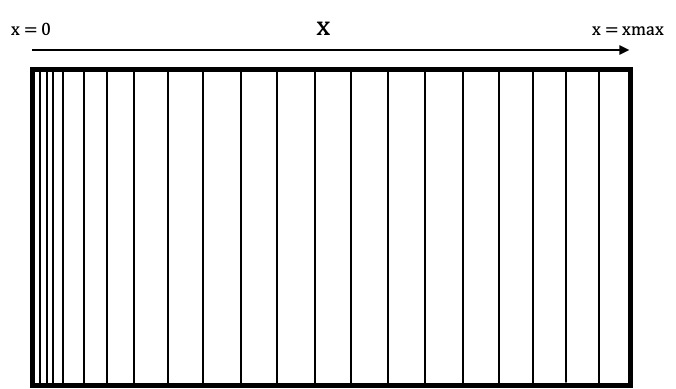
I'm trying to solve a system of two PDE that are dependent on time and distance (H[x,t] and P[x,t]). I'm solving the problem using the method of lines but I want to generate myself the mesh and introduce it in NDsolve. The mesh that I want to generate is the following

Mesh in 1 D

I need a mesh like this one because the values for one of the functions (P[x,t]) changes with time only very close to x = 0, whereas H[x,t] changes over the whole region 0< x < xmax. Below is an example of the code I'm using

(* Constants *)
f = 38.94; logL = -2;  
Ls = 10^logL; a = 0.5;            
C1 = 1*^-5; dH = 1*^-6;       
Ea = 0.1; 
tmax = 40; (* Time in seconds *)
xmax = 10 Sqrt[dH] Sqrt[tmax]; (* Maximum distance to simulate. cm *)


(* PDE system *)
 eqsH = {D[H[x, t], t] - dH D[H[x, t], x, x] ==  NeumannValue[Ls Exp[a f Ea ] P[x, t] - Ls Exp[-a f Ea ] H[x, t], 
    x == 0], H[x, 0] == 1};
eqsP = {D[P[x, t], t] == NeumannValue[-Ls Exp[a f Ea ] P[x, t] + Ls Exp[-a f Ea ] H[x, t], 
     x == 0], P[x, 0] == 1};

(*Solution of the differential equations*)
prec = 7;
msf = 0.001; 

sol = NDSolve[{eqsH, eqsP}, {H, P}, {x, 0, xmax}, {t, 0, tmax}, 
     AccuracyGoal -> prec, PrecisionGoal -> prec, 
     Method -> {"MethodOfLines", 
       "SpatialDiscretization" -> {"FiniteElement"}}] // First // 
   Quiet;

Can I please get some help in how to create the mesh and introduce it in NDSolve? thanks in advance !

$\endgroup$
1

3 Answers 3

12
$\begingroup$

Here is an alternate approach using a graded mesh.

Define some helper functions for a graded mesh

Here are some functions that I've used to create 1d to 3D anisotropic meshes. Not all functions are used.

(*Import required FEM package*)
Needs["NDSolve`FEM`"];
(* Define Some Helper Functions For Structured Meshes*)
pointsToMesh[data_] :=
  MeshRegion[Transpose[{data}], 
   Line@Table[{i, i + 1}, {i, Length[data] - 1}]];
unitMeshGrowth[n_, r_] := 
 Table[(r^(j/(-1 + n)) - 1.)/(r - 1.), {j, 0, n - 1}]
meshGrowth[x0_, xf_, n_, r_] := (xf - x0) unitMeshGrowth[n, r] + x0
firstElmHeight[x0_, xf_, n_, r_] := 
 Abs@First@Differences@meshGrowth[x0, xf, n, r]
lastElmHeight[x0_, xf_, n_, r_] := 
 Abs@Last@Differences@meshGrowth[x0, xf, n, r]
findGrowthRate[x0_, xf_, n_, fElm_] := 
 Quiet@Abs@
   FindRoot[firstElmHeight[x0, xf, n, r] - fElm, {r, 1.0001, 100000}, 
     Method -> "Brent"][[1, 2]]
meshGrowthByElm[x0_, xf_, n_, fElm_] := 
 N@Sort@Chop@meshGrowth[x0, xf, n, findGrowthRate[x0, xf, n, fElm]]
meshGrowthByElm0[len_, n_, fElm_] := meshGrowthByElm[0, len, n, fElm]
flipSegment[l_] := (#1 - #2) & @@ {First[#], #} &@Reverse[l];
leftSegmentGrowth[len_, n_, fElm_] := meshGrowthByElm0[len, n, fElm]
rightSegmentGrowth[len_, n_, fElm_] := Module[{seg},
  seg = leftSegmentGrowth[len, n, fElm];
  flipSegment[seg]
  ]
reflectRight[pts_] := With[{rt = ReflectionTransform[{1}, {Last@pts}]},
  Union[pts, Flatten[rt /@ Partition[pts, 1]]]]
reflectLeft[pts_] := 
 With[{rt = ReflectionTransform[{-1}, {First@pts}]},
  Union[pts, Flatten[rt /@ Partition[pts, 1]]]]
extendMesh[mesh_, newmesh_] := Union[mesh, Max@mesh + newmesh]

Create a graded horizontal mesh segment

The following will create a horizontal mesh region of 100 elements where the initial element width is 1/10000 the domain length.

(*Create a graded horizontal mesh segment*)
(*Initial element width is 1/10000 the domain length*)
seg = leftSegmentGrowth[xmax, 100, xmax/10000];
Print["Horizontal segment"]
rh = pointsToMesh@seg
(*Convert mesh region to element mesh*)
(*Extract Coords from horizontal region*)
crd = MeshCoordinates[rh];
(*Create element mesh*)
mesh = ToElementMesh[crd];
Print["ListPlot of exponential growth of element size"]
ListPlot[Transpose@mesh["Coordinates"]]
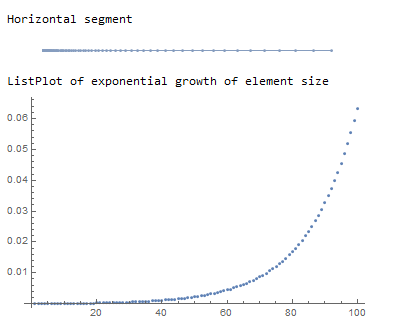
Graded mesh region

One can see the exponential growth of the element size as the element number increases.

Convert the mesh region into an element mesh and solve the PDE

I generally convert the MeshRegion to an 'ElementMesh'so that I can apply element and point markers if needed.

(*Solve PDE on graded mesh*)
{Hfun, Pfun} = 
  NDSolveValue[{eqsH, eqsP}, {H, P}, x ∈ mesh, {t, 0, tmax}, 
   Method -> {"MethodOfLines", 
     "SpatialDiscretization" -> {"FiniteElement"}}];
(*Animate Hfun solution*)
imgs = Plot[Hfun[x, #], x ∈ mesh, 
     PlotRange -> {0.9999999, 1.0018}] & /@ Subdivide[0, tmax, 120];
Print["Animation of Hfun solution"]
ListAnimate@imgs

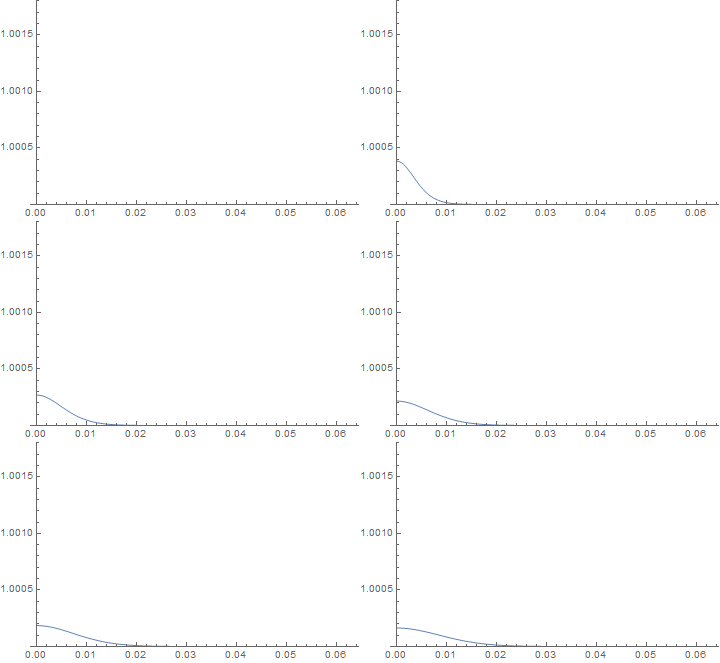
Animation title

Animation

Appendix: Anisotropic meshing examples

As I alluded to in the comment below, the bullet list below shows several examples where I have used anisotropic quad meshing to capture sharp interfaces that would otherwise be very computationally expensive. The code is functional, but not optimal and some of the functions have been modified over time. Use at your own risk

  1. 2D-Stationary
  2. 2D-Transient
  3. 3D-Meshing
  4. 3D-Stationary

If you have access to other tools, such as COMSOL, that have boundary layer functionality, you can import meshes via the FEMAddOns resource function. It will not work for 3D meshes that require additional element types like prisms and pyramids that are not currently supported in Mathematica's FEM.

$\endgroup$
5
  • $\begingroup$ That's great Tim, thanks a lot! $\endgroup$
    – Afmo
    Commented Dec 2, 2020 at 16:51
  • 1
    $\begingroup$ @Afmo you are welcome! I have used anisotropic or graded meshing quite a few times on this site. Perhaps, if I have time, I will add some links to the bottom of the post for reference. Many times anisotropic meshing is the only way to achieve accuracy where you need it with an economical mesh. $\endgroup$
    – Tim Laska
    Commented Dec 2, 2020 at 17:32
  • $\begingroup$ That's it Tim. I was using finer grids but at some point the computational cost is just too high. $\endgroup$
    – Afmo
    Commented Dec 2, 2020 at 20:05
  • 2
    $\begingroup$ @Afmo I added some links to my previous MSE answers that show the benefit of anisotropic meshing in 2D and 3D. It may come in handy if you need to extend to higher dimensions. $\endgroup$
    – Tim Laska
    Commented Dec 3, 2020 at 5:32
  • $\begingroup$ Superb! Thanks again Tim. $\endgroup$
    – Afmo
    Commented Dec 3, 2020 at 7:18
9
$\begingroup$

This is the same approach that Tim describes in his solution, but implemented with the ToGradedMesh function added in version 13.0:

mesh = ToGradedMesh[
   Line[{{0}, {xmax}}], <|"Alignment" -> "Left", 
    "ElementCount" -> 100, "MinimalDistance" -> xmax/10000|>];
MeshRegion[mesh]

mesh

eqsH = {D[H[x, t], t] - dH D[H[x, t], x, x] == 
    NeumannValue[Ls Exp[a f Ea] P[x, t] - Ls Exp[-a f Ea] H[x, t], 
     x == 0], H[x, 0] == 1};
eqsP = {D[P[x, t], t] == 
    NeumannValue[-Ls Exp[a f Ea] P[x, t] + Ls Exp[-a f Ea] H[x, t], 
     x == 0], P[x, 0] == 1};

{Hfun, Pfun} = 
  NDSolveValue[{eqsH, eqsP}, {H, P}, x \[Element] mesh, {t, 0, tmax}, 
   Method -> {"MethodOfLines", "SpatialDiscretization" -> {"FiniteElement"}}];

imgs = Plot[Hfun[x, #], x \[Element] mesh, 
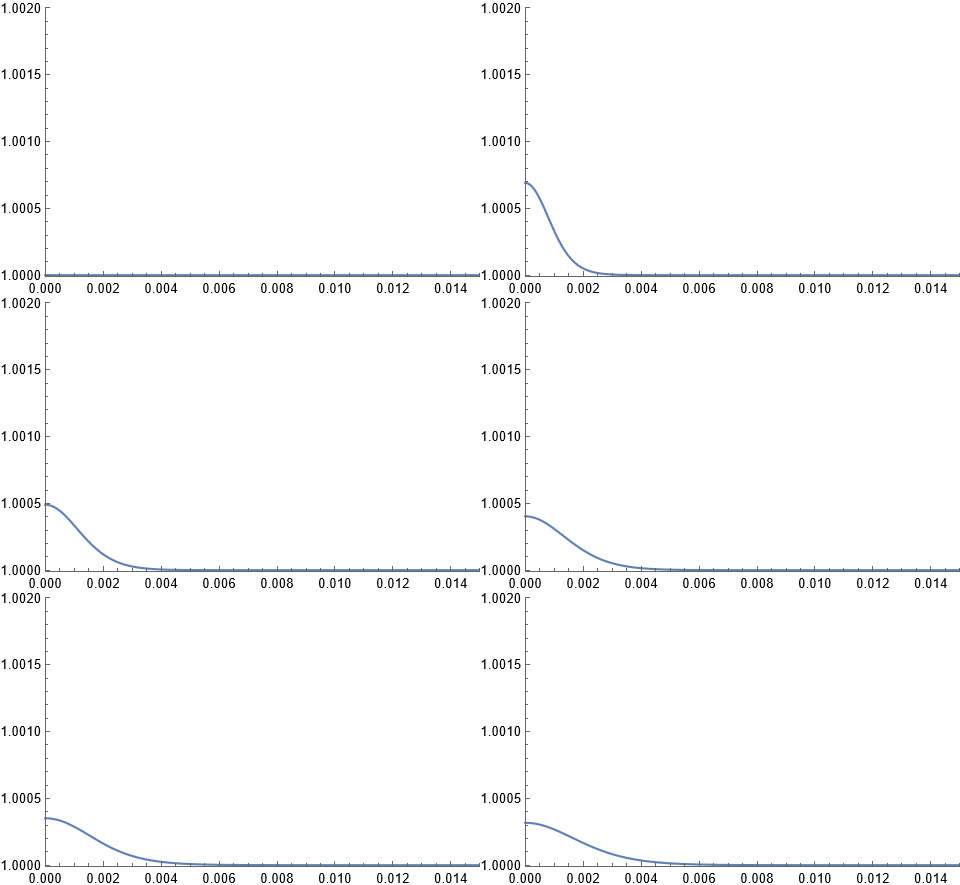
     PlotRange -> {{0, 0.015}, {0.99999, 1.002}}] & /@ Subdivide[0, 2, 120];
ListAnimate@imgs

plot

$\endgroup$
6
$\begingroup$

What about this?

lst1 = Partition[
  Join[Table[0.01*i, {i, 0, 5}], Table[0.1*i, {i, 0, 15}]], 1];
lst2 = Table[{i, i + 1}, {i, 1, Length[lst1] - 1}];

<< NDSolve`FEM`

mesh2 = ToElementMesh["Coordinates" -> lst1, 
  "MeshElements" -> {LineElement[lst2]}]

(*  ElementMesh[{{0., 1.5}}, {LineElement["<" 21 ">"]}]  *)

Let us visualize it:

mesh2["Wireframe"["MeshElementIDStyle" -> Red]]

enter image description here

The red figures indicate the mesh elements. The place where they overlap is in fact the one where the mesh is 10 times denser (see the blown up image below):

enter image description here

Have fun!

$\endgroup$
1
  • $\begingroup$ Thanks a lot Alexei. It is a very helpful answer! $\endgroup$
    – Afmo
    Commented Dec 2, 2020 at 16:44

Your Answer

By clicking “Post Your Answer”, you agree to our terms of service and acknowledge you have read our privacy policy.

Not the answer you're looking for? Browse other questions tagged or ask your own question.