7
$\begingroup$

For positive integers $D$, I have a function s[D_] which creates a list of complex numbers, all of the form $a+b\sqrt{-D}$, where $a$ and $b$ are integers. These numbers have a lattice structure which, unless $D=1$, is not square.

I want to understand how s[D_] is distributed for various $D$, so a 3D histogram is the best way to do this. But, the usual Histogram3D is not very useful because of how the sampling works out with the distribution of the points.

What I'm trying to do: I want to make a 'hexagonal histogram' which:

  1. For each integer pair $(a,b)$ with $|a|,|b|\leq N$, counts how many times $a+b\sqrt{-D}$ appears in s[D_]. (The input variables are $N$ and $D$.)

  2. Generates a 3D graph where, at each complex number $a+b\sqrt{-D}$, there is a vertical bar whose height corresponds to the number of times $a+b\sqrt{D}$ appears in s[D_].

This is almost what the normal Histogram function does, but it checks for values in square subregions of the plane, which is not optimal when my set exists in a non-square lattice.

Optional (but would be very neat): Unfortunately, if rectangular bars are constructed at the lattice vertices, they usually won't fill the space in between them. However, if these bars are more generally look like extruded regular $k$-gons where $k$ depends on $D$, then the resulting histogram will tile the space completely. I can figure out that k[D_] := 2*Pi / Arg[Sqrt[-D]], but I have no idea how to make Mathematica change the form of the graph's bars.

$\endgroup$
6
  • 1
    $\begingroup$ how about ListPointPlot3D[ Append[#, Count[s[d], #[[1]] + #[[2]] Sqrt[-d]]] & /@ Tuples[Range[n], 2], Filling -> Bottom]? $\endgroup$
    – kglr
    Commented Nov 11, 2020 at 5:20
  • 1
    $\begingroup$ or DiscretePlot3D[Count[s[d], a + b Sqrt[-d]], {a, 1, n}, {b, 1, n}, ExtentSize -> Full]? $\endgroup$
    – kglr
    Commented Nov 11, 2020 at 5:32
  • 4
    $\begingroup$ Have you looked at ResourceFunction["HextileBins"] ? $\endgroup$
    – flinty
    Commented Nov 11, 2020 at 11:34
  • $\begingroup$ @flinty I have not, didn't know about it. I'm not sure how to turn those into objects in a plot but I'll try it out when my dataset is finished generating. $\endgroup$ Commented Nov 11, 2020 at 17:22
  • 3
    $\begingroup$ "I'm not sure how to turn those into objects in a plot [...]" -- see the "Applications" sub-section in HextileBins. $\endgroup$ Commented Nov 11, 2020 at 17:55

2 Answers 2

3
$\begingroup$

You can (ab)use the fact that a hexagonal grid can be transformed into a grid with right angles and back. This allows you to use DiscretePlot3D with a custom ExtentElementFunction to get the hexagonal cells on a grid with right angles, which you can then transform into the hexagonal grid:

The transform to go from hexagonal grid -> right angle grid:

transform = 
 ScalingTransform[{1, 2/Sqrt[3], 1}]@*
  ShearingTransform[π/6, {-1, 0, 0}, {0, 1, 0}]

The function to generate the hexagonal cells: (note that the hexagon generated by CirclePoints is transformed using transform to make it fit onto the right-angle grid)

hex[{{x1_, x2_}, {y1_, y2_}, {z1_, z2_}}, ___] :=
 Polygon@Join[
     # (bottom and top faces),
     MapThread[Join[#, Reverse@#2] &, Partition[#, 2, 1, {1, 1}] & /@ #] (* 6 side faces *)
     ] &[(* generate the two bottom and top faces *)
  (# {x1, y1, 1} + (1 - #) {x2, y2, 0} & /@ 
      transform[
       Append[#] /@ (0.5 + 
          CirclePoints[{0.5/Cos[π/6], π/6}, 6])]) & /@ {z1, z2}
  ]

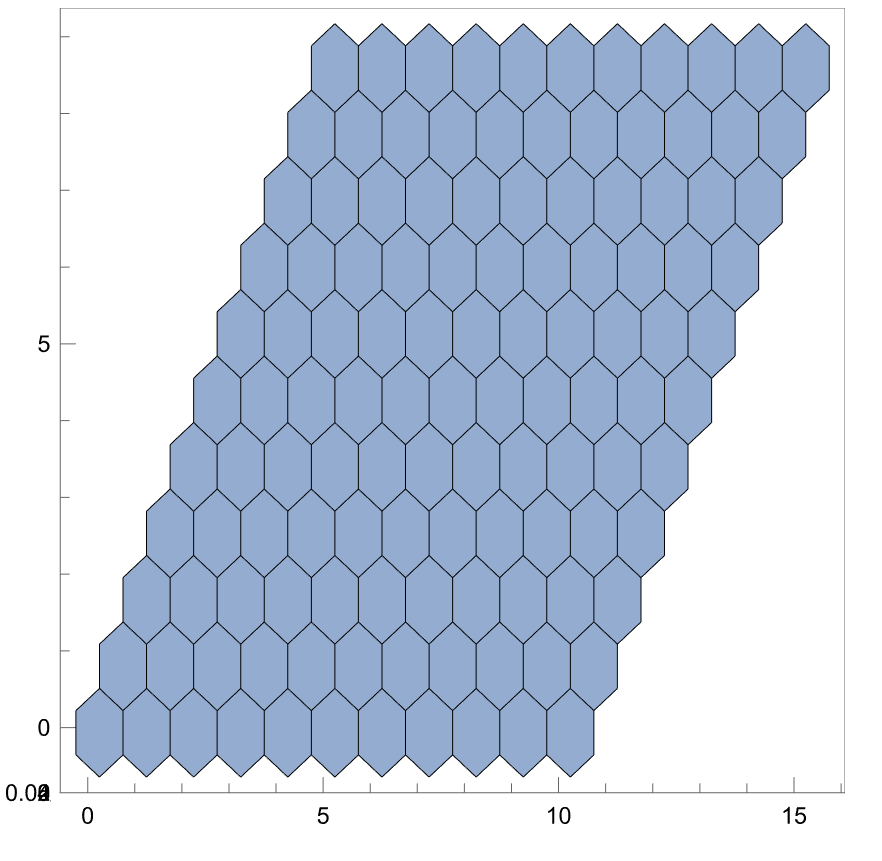
An example plot now looks like this from the top:

DiscretePlot3D[
 PDF[MultivariatePoissonDistribution[3, {1, 1}], {t, u}], {t, 0, 
  10}, {u, 0, 10},
 ExtentSize -> Full,
 ExtentElementFunction -> hex,
 ViewPoint -> {0, 0, \[Infinity]},
 PlotStyle -> EdgeForm@Black
 ]

enter image description here

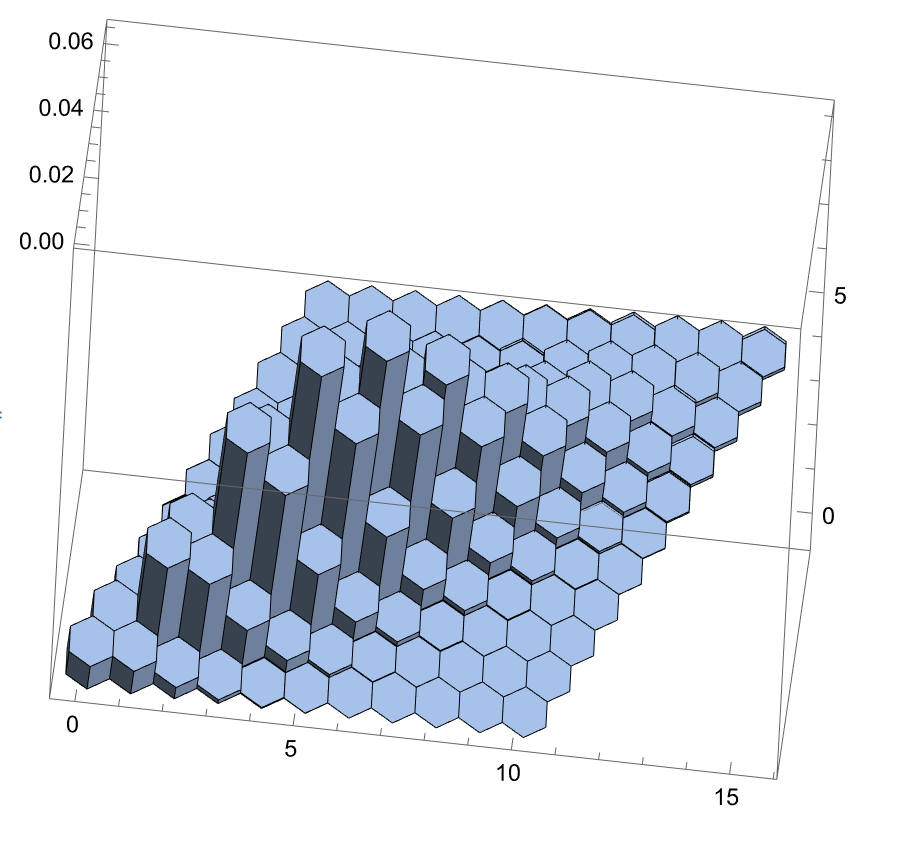
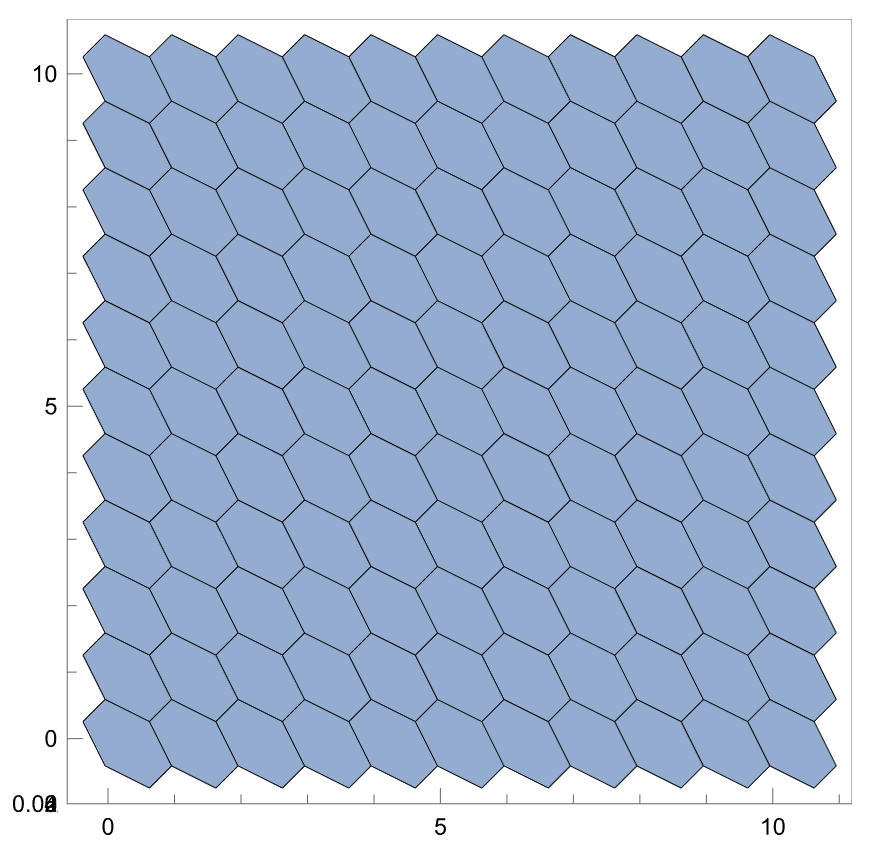
Applying the inverse of transform to the result gives you the undistorted grid:

DiscretePlot3D[
  PDF[MultivariatePoissonDistribution[3, {1, 1}], {t, u}], {t, 0, 
   10}, {u, 0, 10},
  ExtentSize -> Full,
  ExtentElementFunction -> hex,
  ViewPoint -> {0, 0, \[Infinity]},
  PlotStyle -> EdgeForm@Black
  ] // MapAt[GeometricTransformation[#, InverseFunction@transform] &, 
  1]

enter image description here enter image description here

$\endgroup$
0
$\begingroup$

Have you looked into ChartElementFunction for Histogram3D?

This is not the solution but just a pointer:

renderer[c : {{x0_, x1_}, {y0_, y1_}, {z0_, z1_}}, data_, meta_] := 
 Print[c]

For example:

cuboid[c : {{x0_, x1_}, {y0_, y1_}, {z0_, z1_}}, data_, meta_] := 
 Cuboid @@ Transpose@c
Histogram3D[RandomReal[1, {100, 2}], ChartElementFunction -> cuboid]

Combining with a customized binning function, I think this might be enough of information you will need to create a hexagonal histogram.

$\endgroup$

Your Answer

By clicking “Post Your Answer”, you agree to our terms of service and acknowledge you have read our privacy policy.

Not the answer you're looking for? Browse other questions tagged or ask your own question.