I'd like to know how to fit the normal distribution curve between $x$ and $y$ values so that the curve maintains its bell shape. I guessed the sigma is the scale ratio, but it doesn't work as I suspected.
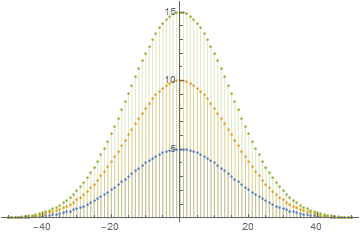
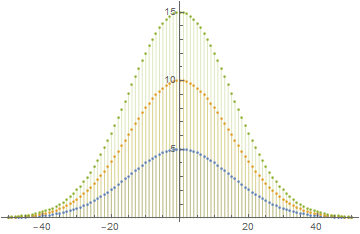
The following is my Mathematica code where I tried to get the maximum to be $y = 15$ at $x = 0$. I also want $x$ to range over $0,\, 1,\,\ldots, 100$. I have started the plot from -50 to get the whole shape of the curve.
With[{sigma = 15, mu = 0},
  t = Table[E^(-(x - mu)^2/(2 sigma^2)), {x, -50, 50}];
  ListPlot[t #& @ #[t]& /@ {Mean, Variance, Median},
  PlotRange -> Full, Filling -> Bottom]]
I thought that I could use median, or variance, or mean values to lift the curve up to 15, but it didn't work as I expected.
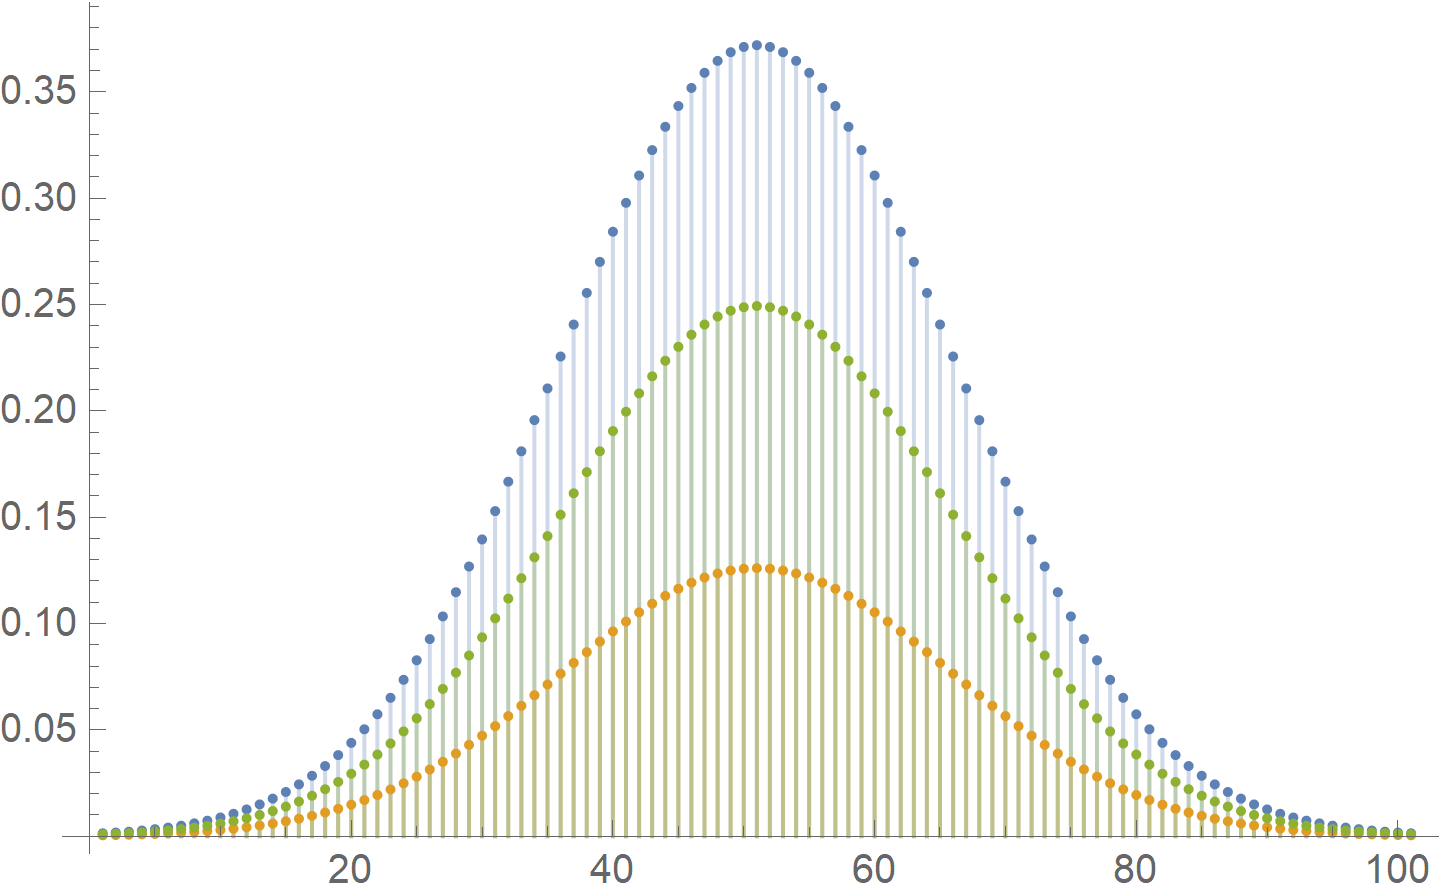
Can you help modify the code so that the curve will reach $y = 15$ rather than $y \sim 0.38$ and still keep the shape of a normal distribution curve?
Below is the image of the plots from the code above.


