I'm trying to recreate a graph from a paper, and the function that I'm plotting involves three separate parabolic cylinder functions that all have a complex Nu value. After getting it all typed out, I end up with an empty plot. I've gone back to basics and have fiddled around with ParabolicCylinderD, and have found that I can plot it no problem with a real Nu, but as soon as I make Nu complex I end up with an empty plot. What am I doing wrong?
Edit:
I'll put in the test code I used while playing with the function to see if it worked, but it's just a case of using a complex input with the function to see if it works.
Plot[ParabolicCylinderD[2,p],{p,0,50}]
That one worked totally fine, got a good plot from it.
Plot[ParabolicCylinderD[2 I,p],{p,0,50}]
This one didn't work at all, got an empty plot as a result.


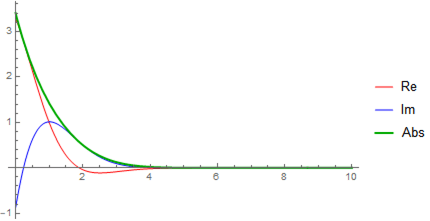
ReImPlot[ParabolicCylinderD[2 I, p], {p, 0, 8}, PlotRange -> All, PlotLegends -> Placed["ReIm", {0.5, 0.5}]]orPlot[Evaluate@ReIm@ParabolicCylinderD[2 I, p], {p, 0, 8}, PlotRange -> All, PlotLegends -> Placed[{Re, Im}, {0.5, 0.5}]]orPlot[Evaluate[#[ParabolicCylinderD[2 I, p]] & /@ {Re, Im}], {p, 0, 8}, PlotRange -> All, PlotLegends -> Placed[{Re, Im}, {0.5, 0.5}]]$\endgroup$