I have a dynamic graph which changes depending on the current selection from a drop down box. All selections from the drop down box give fine results except one. For the one selection it shows the y
axis in scientific notation. I understand that this is due to the values being large but I don't want this to happen. I also can't specify the y
axis values manually, I need to use the FrameTicks->Automatic
functionality. Is there any way to stop the y-axis ticks from displaying in scientific notation?
-
1$\begingroup$ Hi Lara! Please review your past questions. You never voted and never accepted an answer! $\endgroup$– Dr. belisariusCommented Apr 3, 2013 at 10:08
-
1$\begingroup$ related question: mathematica.stackexchange.com/q/3436/66 $\endgroup$– faysouCommented Apr 3, 2013 at 10:26
-
$\begingroup$ Possible duplicate: mathematica.stackexchange.com/questions/6851/… $\endgroup$– Michael E2Commented Apr 3, 2013 at 10:42
-
$\begingroup$ belisarius, I dont know how to $\endgroup$– laraCommented Apr 3, 2013 at 11:03
-
$\begingroup$ @LaraJordan mathematica.stackexchange.com/faq#howtoask $\endgroup$– cormullionCommented Apr 3, 2013 at 11:07
2 Answers
This is definitely possible but you will need to define your own FrameTicks
function. Fortunately you can do this with a defined auxiliary function.
You can use the information in the answers to this question to develop a custom tick function.
This answer provides some ideas about how to define a different format for your ticks.
You don't provide sample data, but here is an example which fits:
fakedata = RandomReal[{1*10^6, 3*10^9}, 10];
niceticks[min_, max_] := {#, NumberForm[#, DigitBlock -> 3], {0.02, 0}} & /@
FindDivisions[{min, max}, 6]
ListLinePlot[fakedata, Frame -> True,
FrameTicks -> {{niceticks, None}, {Automatic, None}}]
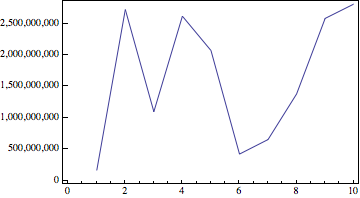
This approach will allow you to specify nice ticks for any data range, without knowing in advance what that range might be.
Given you have a very stretched AspectRatio
, you will need a smaller number for the tick length: the number is a fraction of the plot width.
niceticks[min_, max_] := {#, NumberForm[#, DigitBlock -> 3], {0.01, 0}} & /@
FindDivisions[{min, max}, 6]
Getting the x-ticks you want requires a similar approach, but the custom function can be simpler:
tickateveryinteger[min_, max_] := Range[Floor[min], Ceiling[max]]
Resulting in:
ListLinePlot[fakedata, Frame -> {{True, False}, {True, False}},
FrameTicks -> {{niceticks, None}, {tickateveryinteger, None}},
AspectRatio -> 1/5]
-
$\begingroup$ This is close, but when I use this how do I specify the range for the x axis ticks ? I need to see all the numbers and not just multiples of 2 on the x axis. Also, when I use this the tick marks on the y axis are stretched with my graph and look terrible. $\endgroup$– laraCommented Apr 3, 2013 at 11:00
-
$\begingroup$ Ok, I will edit for somethimg more precise. The issue with the tick length occurs because they are specified as fractions of the plot length. $\endgroup$– VerbeiaCommented Apr 3, 2013 at 11:03
-
$\begingroup$ I found out about the x axis problem, now it's just the problem of getting rid of the long ticks on the y axis. $\endgroup$– laraCommented Apr 3, 2013 at 11:08
-
-
$\begingroup$ That works fine for the one graph but not too great when I choose one of the other drop down options and the graph displays something else. Is there not a way (perhaps with OptionInspector) to make sure Mathematica NEVER uses scientific notation anywhere at all? $\endgroup$– laraCommented Apr 3, 2013 at 11:53
Does this work for you?
data = {#, # + 10^7} &@Table[2.5 10^8 + RandomInteger[10^8], {8}];
g = ListLinePlot[data, Axes -> False,
Frame -> {{True, False}, {True, False}}];
newticks =
AbsoluteOptions[g,
FrameTicks] /. {x_Real, x_, y__} :> {x, AccountingForm[x], y};
Show[g, newticks, AspectRatio -> 1/5]
The above changes all ticks to AccountingForm
, which doesn't seem to matter for your example. If you want just the y
axis reformatted, then the following works:
newticks =
FrameTicks ->
MapAt[# /. {x_Real, x_, y__} :> {x, AccountingForm[x], y} &,
FrameTicks /. AbsoluteOptions[g, FrameTicks], 2];
Show[g, newticks, AspectRatio -> 1/5]
Note: The documentation indicates that FrameTicks
should have the structure {{left, right}, {bottom, top}}
but AbsoluteOptions[g, FrameTicks]
returns {bottom, left, top, right}
. It seems to be an undocumented alternative.