0
$\begingroup$

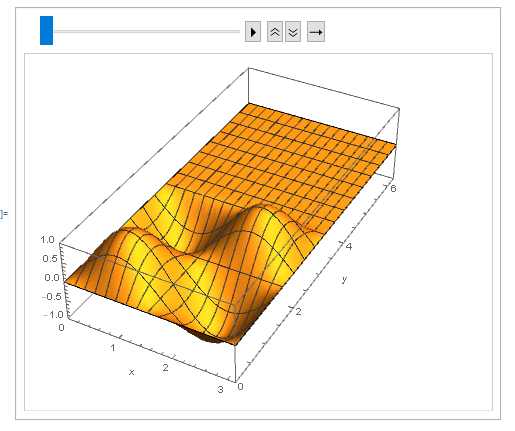
I have code to solve the 2D wave equation on a given region with an initial condition that is sinusoidal in one part of the region and 0 elsewhere. Here is an example on a rectangular region that works just fine, with plot shown at t=0:

weq = Laplacian[u[x, y, t], {x, y}] == D[u[x, y, t], {t, 2}];

bc = {u[x, 2 Pi, t] == 0, u[x, 0, t] == 0, u[0, y, t] == 0, 
   u[Pi, y, t] == 0};

ic = {u[x, y, 0] == 
    If[0 <= x <= Pi && 0 <= y <= Pi, Sin[m x] Sin[n y], 0], 
   Derivative[0, 0, 1][u][x, y, 0] == 0};

nsol2 = Quiet[NDSolve[{weq, bc, ic} /. {m -> 2, n -> 2}, 
   u, {x, 0, Pi}, {y, 0, 2 Pi}, {t, 0, 5}]];

ListAnimate[
 Table[Plot3D[u[x, y, t] /. nsol2, {x, 0, \[Pi]}, {y, 0, 2 \[Pi]}, 
   AxesLabel -> Automatic, 
   PlotRange -> {{0, \[Pi]}, {0, 2 \[Pi]}, {-1, 1}}, 
   BoxRatios -> {1, 2, 0.5}], {t, 0, 5, 0.5}]]

rectangle bound at t=0

I want to keep the same initial condition ic that is sinusoidal in the [{0,0},{Pi,Pi}] rectangle and zero elsewhere, but with a curved guide as a Dirichlet boundary instead of the rectangular boundary used above.

bc2 = DirichletCondition[u[x, y, t] == 0, True]
tube = Region[
  RegionUnion[Rectangle[{0, 0}, {Pi, Pi}], 
   Rectangle[{2 Pi, -2 Pi}, {3 Pi, -Pi}], 
   Region[Annulus[{Pi, -Pi}, {Pi, 2 Pi}, {0, Pi/2}]]]]

benttubesol = 
 Quiet[NDSolve[{weq, bc2, ic} /. {m -> 2, n -> 2}, 
   u, {x, y} \[Element] tube, {t, 0, 15}]]

ListAnimate[
 Table[Plot3D[u[x, y, t] /. benttubesol, {x, y} \[Element] tube, 
   AxesLabel -> Automatic, 
   PlotRange -> {{0, 3 \[Pi]}, {-2 Pi, \[Pi]}, {-1, 1}}, 
   BoxRatios -> {1, 1, 0.5}], {t, 0, 15, 1}]]

bent tube bound at t=6

The [{0,0},{Pi,Pi}] rectangle is mysteriously absent from the 3DPlot, although the part of the tube that does appear evolves correctly in time (the above is after some time has passed). Why could this be? I think it's related to the if function in ic, but I don't know what I could change to fix it.

$\endgroup$
7
  • $\begingroup$ Welcome to Mathematica.SE! I suggest the following: 1) As you receive help, try to give it too, by answering questions in your area of expertise. 2) Take the tour and check the faqs! 3) When you see good questions and answers, vote them up by clicking the gray triangles, because the credibility of the system is based on the reputation gained by users sharing their knowledge. Also, please remember to accept the answer, if any, that solves your problem, [by clicking the checkmark sign](tinyurl.com/4srwe26 $\endgroup$
    – Dunlop
    May 23, 2020 at 5:24
  • $\begingroup$ It seems like you are missing a bit of code in the first part of your answer that describes your nsolve2 ? Are you wanting to plot both solutions together? $\endgroup$
    – Dunlop
    May 23, 2020 at 5:26
  • $\begingroup$ @Dunlop Thank you; I've added it. I don't want to plot them both together, I just find it strange that the [{0,0},{Pi,Pi}] rectangle appears in that first case and not the second, where I also want it to be. $\endgroup$ May 23, 2020 at 5:39
  • $\begingroup$ I see what you mean. You can also plot the solution for the second one if you restrict the plot range to the [{0,0},{Pi,Pi}] rectangle only. So it is solving there, it seems like there is something strange going on with the 3D plot $\endgroup$
    – Dunlop
    May 23, 2020 at 5:59
  • $\begingroup$ Try this: ListAnimate[ Table[Plot3D[ u[x, y, t] /. benttubesol, {x, -1, 3 \[Pi]}, {y, -2 \[Pi], \[Pi]}, AxesLabel -> Automatic, PlotRange -> {{-1, 3 \[Pi]}, {-2 Pi, \[Pi]}, {-1, 1}}, BoxRatios -> {1, 1, 1}], {t, 0, 15, 1}]] $\endgroup$
    – Dunlop
    May 23, 2020 at 6:04

1 Answer 1

2
$\begingroup$

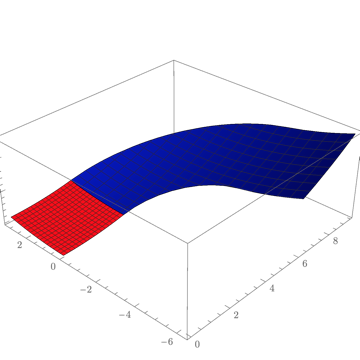
Here's something to show the issue in a more minimal example

tube=
  Region[
     RegionUnion[
      Rectangle[{0, 0}, {Pi, Pi}],
      Rectangle[{2 Pi, -2 Pi}, {3 Pi, -Pi}], Region[Annulus[{Pi, -Pi}, {Pi, 2 Pi}, {0, Pi/2}]]]
     ];
Show[
 Plot3D[x^2 + y^2, 
  {x, y} \[Element] Rectangle[{0, 0}, {Pi, Pi}],
  PlotStyle -> Red
  ],
 Plot3D[x^2 + y^2, 
  {x, y} \[Element] tube,
  PlotStyle -> Blue
  ]
 ]

enter image description here

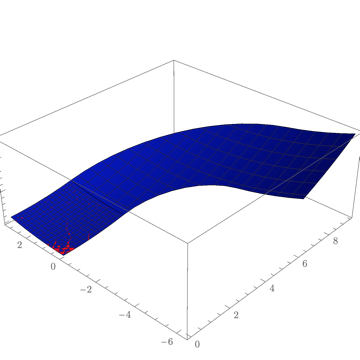
If you instead use DiscretizeRegion on tube it seems to work

Show[
 Plot3D[x^2 + y^2, 
  {x, y} \[Element] Rectangle[{0, 0}, {Pi, Pi}],
  PlotStyle -> Red
  ],
 Plot3D[x^2 + y^2, 
  {x, y} \[Element] DiscretizeRegion@tube,
  PlotStyle -> Blue
  ]
 ]

enter image description here

Suggests that it's a bug in Plot3D. I'd email Wolfram about it.

$\endgroup$
1
  • $\begingroup$ Thank you so much; I'll reach out to them! $\endgroup$ May 23, 2020 at 12:08

Your Answer

By clicking “Post Your Answer”, you agree to our terms of service and acknowledge you have read our privacy policy.

Not the answer you're looking for? Browse other questions tagged or ask your own question.