2
$\begingroup$

Basically, I have a set of differential equations that I need to solve for exactly 100 different initial conditions (given as lists for each initial condition), and then plot each solution.

Here is some sample code where I have set vrad, vtan, and deltaR (arrays of initial conditions) to an array of length two. So, given the arrays vrad, vtan, deltaR (our initial conditions) I want to be able to essentially do what this code does but for the array of solutions. Cheers!

Edit: I think I've nearly done it, I just need Table to not iterate through every tuple, but instead by index, anyone know how to do this?

(* Scaling Quantities *)
V = 200;
R = 10^4;
(* Random Quantities *)
vrad = {0, 5};
vtan = {0, 5};
deltaR = {0, 5};
(* Converting to dimensionless quantities *)
vRadial = (V + vrad)/V;
vTangential = (V + vtan)/V;
r0 = (10^4 + deltaR)/R;
L = r0*vTangential;
(* numerical solution *)
s = Partition[
  Flatten@Table[
    NDSolve[{r''[t] == r[t]*ϕ'[t]^2 - 1/r[t], ϕ'[t] == d/
       r[t]^2, ϕ[0] == a, r[0] == b, 
      r'[0] == c}, {r, ϕ}, {t, 0, 200}], {a, vTangential/r0}, {b,
      r0}, {c, vRadial}, {d, L}], 2]
(* Plotting the solution *)
ParametricPlot[
 Evaluate[{r[t]*Cos[ϕ[t]], r[t]*Sin[ϕ[t]]} /. s], {t, 0, 
  2*Pi}, GridLines -> Automatic, Frame -> True]
$\endgroup$
9
  • 2
    $\begingroup$ Also, what iteration would you like to perform? With even two examples, someone on this list might be able to help. Are you trying to loop through vrad, vtan, and deltaR from 0 to 5 by some amount (.05, for example)? And then, do you want to get a solution for when they are all zero, then .05, then .1, etc? $\endgroup$
    – Mark R
    Commented Mar 13, 2020 at 2:05
  • $\begingroup$ So I want to go by index i.e. take the first element of each array, then the second element of each array, and so on (producing a solution for each index). In this case, initial conditions I want are (0,0,0,0) and (5,5,5,5) $\endgroup$
    – charl1e
    Commented Mar 13, 2020 at 2:09
  • $\begingroup$ Table goes through all possible combinations of the independent variables (as you are seeing). $\endgroup$
    – Mark R
    Commented Mar 13, 2020 at 2:10
  • $\begingroup$ Yep, so is there a simple/alternative way to go by index? $\endgroup$
    – charl1e
    Commented Mar 13, 2020 at 2:10
  • $\begingroup$ Something like this might give you what you want:Transpose@ConstantArray[Range[0, 10], {3}] $\endgroup$
    – Mark R
    Commented Mar 13, 2020 at 2:11

2 Answers 2

4
$\begingroup$

I think this will do what you want:

s = NDSolve[{r''[t] == 
      r[t]*\[Phi]'[t]^2 - 1/r[t], \[Phi]'[t] == #[[4]]/r[t]^2, \[Phi][
       0] == #[[1]], r[0] == #[[2]], 
     r'[0] == #[[3]]}, {r, \[Phi]}, {t, 0, 200}] & /@ 
  Transpose[{vTangential/r0, r0, vRadial, L}]

Your current solution has only 2 values for each of these but it extends to as many as you'd like.

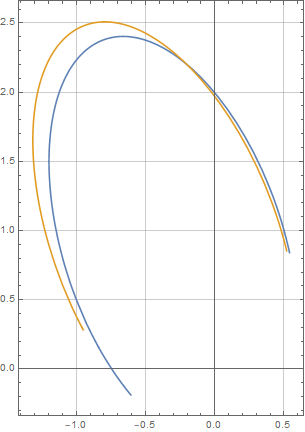
And here is the picture: enter image description here

$\endgroup$
1
  • $\begingroup$ Amazing. Thank you for your patience :) $\endgroup$
    – charl1e
    Commented Mar 13, 2020 at 2:25
2
$\begingroup$

An alternative approach:

  1. If you use ParametricNDSolveValue you don't have run NDSolve for each 4-tuple of input parameters.
  2. Using the function you want to plot as the second argument of ParametricNDSolveValue you can use the output directly in plot functions without additional processing.

ClearAll[pndsv]
pndsv = ParametricNDSolveValue[{r''[t] == r[t]*ϕ'[t]^2 - 1/r[t], ϕ'[t] == d/r[t]^2, 
    ϕ[0] == a, r[0] == b, r'[0] == c},
   {r[#] Cos[ϕ[#]], r[#] Sin[ϕ[#]]} &, 
   {t, 0, 200}, 
   {a, b, c, d}]; 

params = Transpose[{vTangential/r0, r0, vRadial, L}]; 

ParametricPlot[Evaluate[pndsv[##][t] & @@@ params], {t, 0, 2  Pi}, 
 GridLines -> Automatic, Frame -> True]
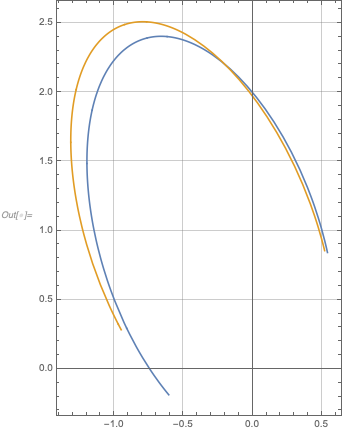
enter image description here

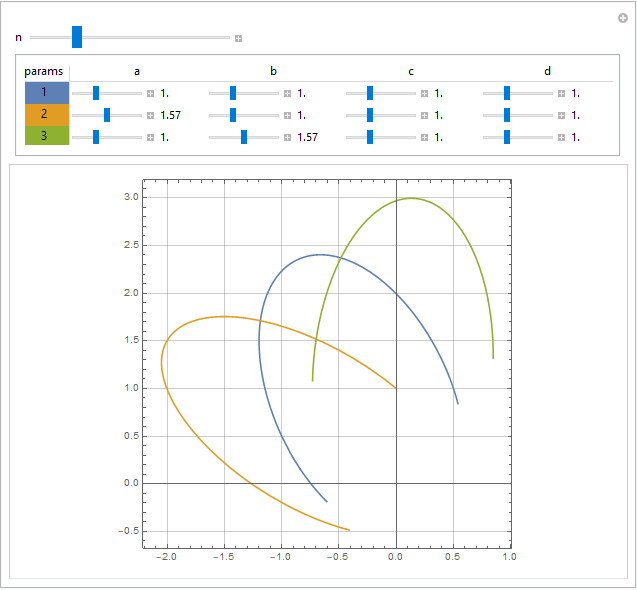
Interactively set up to 10 sets of parameters using control label styles as legend for the curves shown:

k = 10;
Manipulate[ParametricPlot[Evaluate[pndsv[##][t] & @@@ Take[psets, n, 4]], {t, 0, 2  Pi}, 
    GridLines -> Automatic, Frame -> True, ImageSize -> 400, AspectRatio -> 1],
  {{psets, ConstantArray[1., {k, 4}]}, None},
  {{n, 3}, 1, 10, 1}, 
  Dynamic[Panel[Grid[Prepend[#, {"params", "a", "b", "c", "d"}] &@
    MapIndexed[Prepend[#, #2[[1]]] &, Outer[Manipulator[Dynamic[psets[[#1, #2]]], {0, 3},
         Appearance -> "Labeled", ImageSize -> Tiny] &, Range[n], Range[4]]], 
   FrameStyle -> LightGray, 
   Background -> {None, None, {# + 1, 1} -> ColorData[97]@# & /@ Range[n]}, 
   Dividers -> {{False, True}, {False, True}}]]], 
 Alignment -> Center]

enter image description here

$\endgroup$

Your Answer

By clicking “Post Your Answer”, you agree to our terms of service and acknowledge you have read our privacy policy.

Not the answer you're looking for? Browse other questions tagged or ask your own question.