2
$\begingroup$

In an earlier post I asked for a 3D plot of Plot3D[Sqrt[((x^2 + y^2)/((x*y) + 1))], {x, -20, 20}, {y, -20, 20}] along with it's integer roots and in turn plot of those. (3D plot Versus actual values).

I would like now to see whether Mathematica can depict: To show the contribution of the +1 in the denominator, what if we were to graph it with just the x*y in the denominator like (x^2+y^2)/x y then do another one with a -1 like (x^2+y^2)/(x y-1), then have the resulting graphs interlaced/transposed on top of one another to see the contribution. Is there a function to allow this visibility?

Now let me expand a little more on this: Can I plot Plot3D[Sqrt[((x^2 + y^2)/((x*y) + n))] where -10<=n<=+10 and have Mathematica put that into motion to see how the function evolves around those values? That's 1 degree of freedom. Can that be combined with x^2-y^2 in the numerator (instead of the +)?

Thanks, Steve.

$\endgroup$
2
  • $\begingroup$ Are you familiar with the Animate command? I am asking whether you have tried it and it has not worked yet or not. $\endgroup$
    – user49048
    Commented Jan 31, 2020 at 8:45
  • $\begingroup$ I didn’t even know it existed. Lol $\endgroup$
    – Steve237
    Commented Jan 31, 2020 at 12:27

1 Answer 1

2
$\begingroup$

For the first part of what you asked, is the following what you had in mind?

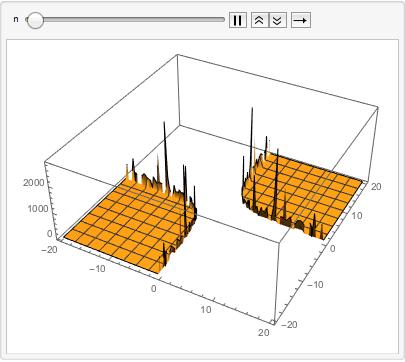
Animate[Plot3D[Sqrt[(x^2 + y^2)/(x*y + n)], {x, -20, 20}, {y, -20, 20}, 
   PlotRange -> All], {n, -10, 10}]

So, just have a free parameter n and allow it to take values in a specific range whilst animating the plot. This results in the following

plot1

You can hit pause and then start shifting the value around to play with the graph.

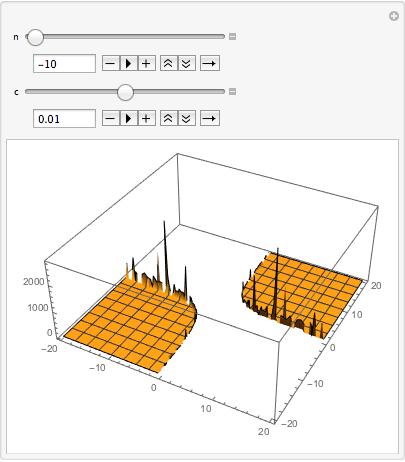
And then you mentioned a change in the numerator. So, multiply by a constant and then allow for the constant to take values in the range $[-1,1]$. If I understood correctly the following gives what you asked for

Manipulate[Plot3D[Sqrt[(x^2 + c*y^2)/(x*y + n)], {x, -20, 20}, {y, -20, 20}, 
   PlotRange -> All], {n, -10, 10, Appearance -> "Open"}, 
  {{c, 1}, -1, 1, Appearance -> "Open"}]

which gives

plot2

$\endgroup$
3
  • $\begingroup$ Wow amazing man! This is precisely what I was looking for. Wow Mathematica is so powerful! I assume we can play one variable at a time for a motion picture. And also same formats will apply to 2D plots as well? P.S. I tried to vote you up but could. It as I am a new user here. $\endgroup$
    – Steve237
    Commented Jan 31, 2020 at 12:20
  • $\begingroup$ @Steve237 you can accept it as an answer if you want, but don't worry too much about upvoting stuf. About the simple Mma plots, you just asked for, sure you can apply the same. I just did not know you wanted that as well. Here's a related link to get you set up and started reference.wolfram.com/language/ref/Animate.html $\endgroup$
    – user49048
    Commented Jan 31, 2020 at 12:31
  • $\begingroup$ Amazing, yes Thx! $\endgroup$
    – Steve237
    Commented Jan 31, 2020 at 13:32

Your Answer

By clicking “Post Your Answer”, you agree to our terms of service and acknowledge you have read our privacy policy.

Not the answer you're looking for? Browse other questions tagged or ask your own question.