I'm trying to replicate "symmetric icons" from this book:
https://www.amazon.com/Symmetry-Chaos-Search-Pattern-Mathematics/dp/0898716721
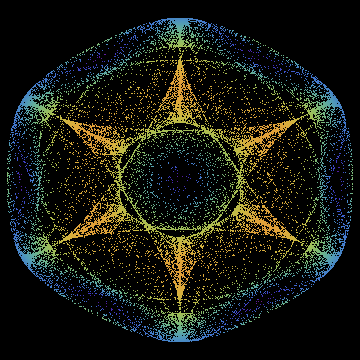
Here is what I have so far:
n = 6;
α = 5;
β = 1.5;
γ = 1;
ω = 0;
λ = -2.7;
f[z_] := (λ + α z Conjugate[z] + β Re[z^n] + ω I)z + γ Conjugate[z]^(n - 1);
z0 = .1 +.1 I;
(*data=NestList[f,z0,100000];*)
ListPlot[
  {Re[#], Im[#]}& /@ NestList[f, z0, 100000],
  AspectRatio -> 1,
  Axes -> False,
  PlotStyle -> {Opacity[.45], White, Small},
  Background -> Black]
I have two questions:
1) I have a vague idea that instead of using ListPlot, I can use Image and then map the points to pixels, counting the number of times a pixel is hit, and then coloring each pixel somehow using ColorFunction. However, I'm not real sure.
2) To make the image above nicer, you should change 100000 to a million, or ten million, and make the Opacity lower. However, I worry that I'm being very inefficient. Is there an obvious way to make this much more efficient?
Edit
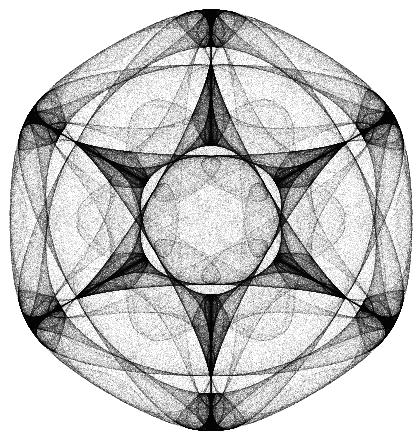
From the help below, the "best" code I have for this is:
f[z_] = (λ + α z Conjugate[z] + β Re[z^n] + ω I)z + γ Conjugate[z]^(n - 1);
z0 = .1 + .1 I;
iter = 10000000;
opac=.1;
Graphics[
  {Black, Opacity[opac], PointSize[Tiny], Point[ReIm @ NestList[f, z0, iter]]}]
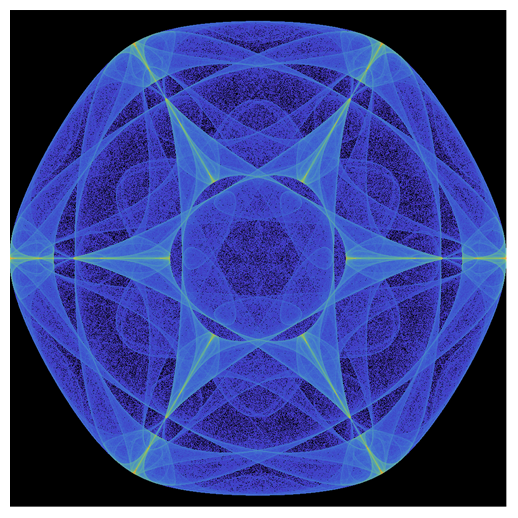
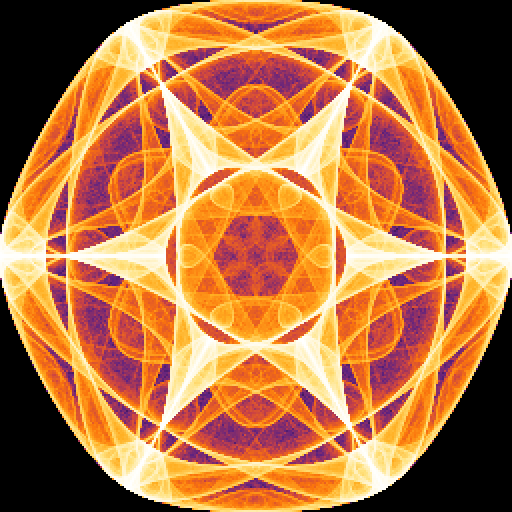
producing
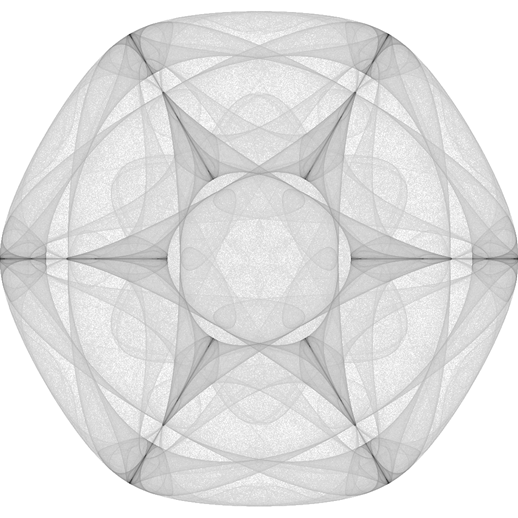
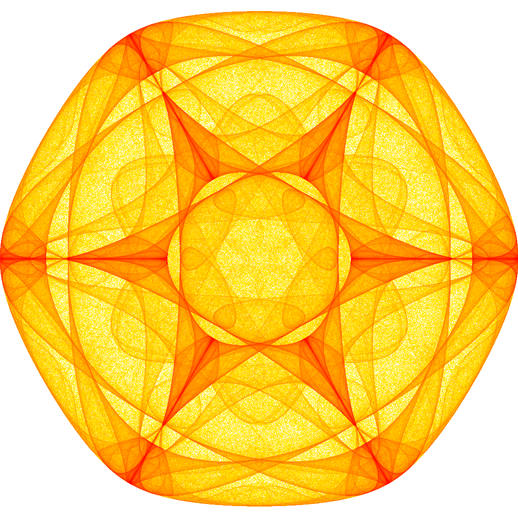
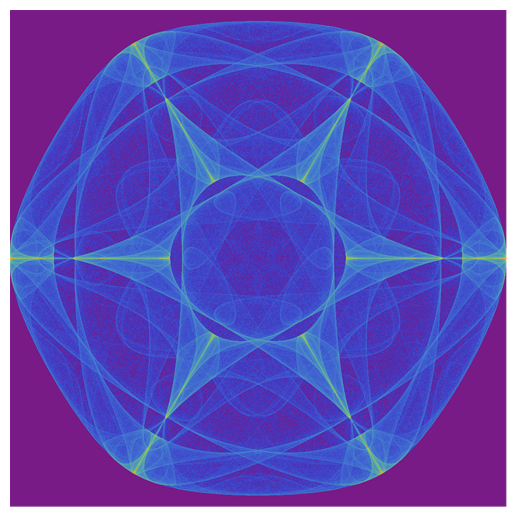
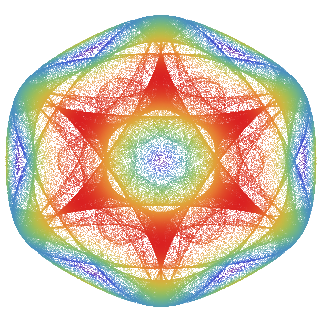
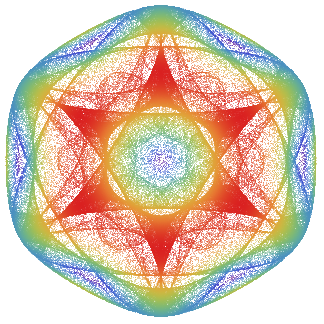
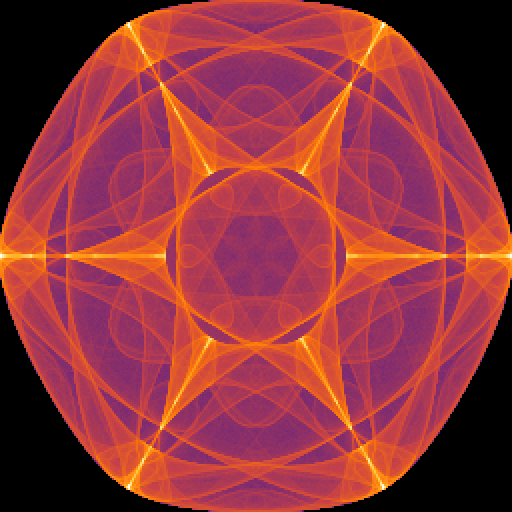
I would like to be able to "simply" add custom colors (based on the number of times a neighborhood is hit by a point in the iteration) to an Image like this:
res = 1000;
colorLim = 1;
dataBin =
  Map[GrayLevel,
    Sqrt[(1/colorLim) *
      Transpose @
        BinCounts[
          {Re[#],Im[#]}&/ @ NestList[f, z0, 1000000],
          {-1, 1, 1/res}, {-1, 1,1/res}]],
    {2}];
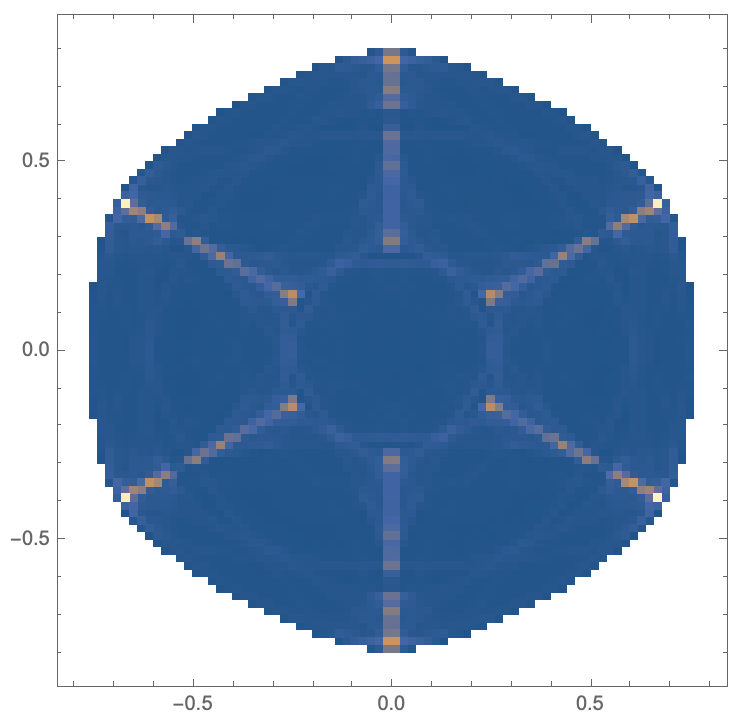
Image[dataBin]
but this is eluding me right now.

Re[#], Im[#]} &can be replaced withReIm. $\endgroup$