13
$\begingroup$

Heike gave an absolutely wonderful answer to my question about arranging subplots around a main plot and including connector lines. This is the result:

Mathematica graphics

Starting from Heike's answer, what is the best order to arrange the subplots in so the connector lines are as easy to follow / as aesthetically arranged as possible?

To have something concrete to test with, let's say we have 12 points in the unit square. These are the starting points of the lines.

start = RandomReal[1, {12, 2}];

The set of endpoints is fixed (due to the subplot positions):

end = With[{dx = 0.1, dy = 0.1}, 
       {{-dx, 1 + dy}, {.25 - dx/4, 1 + dy}, {.75 + dx/4, 1 + dy}, 
        {1 + dx, 1 + dy}, {1 + dx, .75 + dy/4}, {1 + dx, .25 - dx/4}, 
        {1 + dx, -dy}, {.75 + dx/4, -dy}, {.25 - dx/4, -dy}, 
        {-dx, -dy}, {-dx, .25 - dy/4}, {-dx, .75 + dy/4}}];

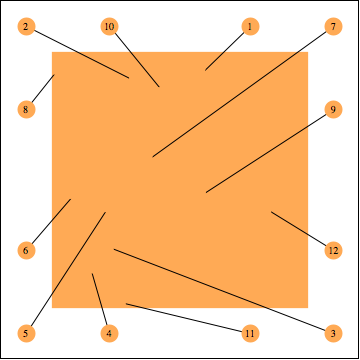
Then the plot will look similar to this:

Graphics[{
  FaceForm[Lighter@Orange], Polygon[{{0, 0}, {1, 0}, {1, 1}, {0, 1}}],
  Line@Transpose[{start, end}],
  AbsolutePointSize[18], Lighter@Orange, Point[end], 
  Black, MapThread[Text, {Range[12], end}]}, 
  Frame -> True, FrameTicks -> None, PlotRange -> {{-.2, 1.2}, {-.2, 1.2}}]

Mathematica graphics

Given the starting points in the orange square, how can we automatically reorder the labelled endpoints so the lines cross as little as possible (or generally: the figure looks as good as possible)?

Please try to make your answers complete, with a sample output figure using the code above. When it is not possible to avoid that the lines cross, what the "best" arrangement is is admittedly somewhat subjective.


Note: This is a question that I thought others would be interested in too. It is not a practical problem I am facing (I ordered the subplots manually in my figure), but of course if there are any good solutions, I will use them. I will be working on solutions as well.

Note 2: Given two lists, l1 and l2, containing the same elements in different orders, the permutation that re-orders l1 to l2 is Part[Ordering[l1], Ordering@Ordering[l2]]. This may be useful for reordering points.

$\endgroup$

4 Answers 4

12
$\begingroup$

This method tries to find a minimum of the total length of all connecting lines by repeatedly swapping the endpoints of pairs of connecting lines if that reduces the total length of those two connecting lines until the list of edges doesn't change anymore. From the triangle inequality this then also guarantees that no two connecting lines will intersect each other.

start = RandomReal[1, {12, 2}];
end = With[{dx = 0.1, dy = 0.1}, 
       {{-dx, 1 + dy}, {.25 - dx/4, 1 + dy}, {.75 + dx/4, 1 + dy}, 
        {1 + dx, 1 + dy}, {1 + dx, .75 + dy/4}, {1 + dx, .25 - dx/4}, 
        {1 + dx, -dy}, {.75 + dx/4, -dy}, {.25 - dx/4, -dy}, 
        {-dx, -dy}, {-dx, .25 - dy/4}, {-dx, .75 + dy/4}}];

combis = Subsets[Range[12], {2}];
length[{b_, e_}] := EuclideanDistance[start[[b]], end[[e]]]

newedges = Transpose[{Range[12], Range[12]}];
FixedPoint[
 Do[p = {#[[{1, 4}]], #[[{3, 2}]]} &@Flatten[newedges[[c]]];
   If[Total[length /@ p] < Total[length /@ newedges[[c]]],
    newedges[[c]] = p],
   {c, combis}] &, newedges, 10]

Then the before picture is this:

Mathematica graphics

and the after picture is:

Graphics[{FaceForm[Lighter@Orange], 
  Polygon[{{0, 0}, {1, 0}, {1, 1}, {0, 1}}], 
  Line@Transpose[{start[[newedges[[All, 1]]]],
     end[[newedges[[All, 2]]]]}], AbsolutePointSize[18], 
  Lighter@Orange, Point[end[[newedges[[All, 2]]]]], Black, 
  MapThread[Text, {Range[12], end[[newedges[[All, 2]]]]}]}, 
 Frame -> True, FrameTicks -> None, 
 PlotRange -> {{-.2, 1.2}, {-.2, 1.2}}]

Mathematica graphics

$\endgroup$
4
  • $\begingroup$ +1 Excellent idea. Never thought of using the total length. $\endgroup$
    – Matariki
    Commented Feb 21, 2012 at 22:46
  • $\begingroup$ Grreat!!! Is combis defined elsewhere?+1 $\endgroup$
    – kglr
    Commented Feb 21, 2012 at 22:47
  • $\begingroup$ @kguler It got lost when copy and pasting the code, but it should work now. $\endgroup$
    – Heike
    Commented Feb 21, 2012 at 22:51
  • $\begingroup$ For some reason, with larger data sets this works better: FixedPoint[Map[Function[c, p = {#[[{1, 4}]], #[[{3, 2}]]} &@Flatten[newedges[[c]]]; If[Total[length /@ p] < Total[length /@ newedges[[c]]], newedges[[c]] = p]], RandomSample[combis, Length[combis]]] &, newedges, 10]; $\endgroup$ Commented Nov 27, 2012 at 15:31
8
$\begingroup$

Here is my proposition. Active code in the middle block; the rest for completeness.

Update: now numbers points correctly.

Update: explicit method for FindShortestTour to avoid problems in version 8.

base = RandomReal[1, {12, 2}];
end = With[{dx = 0.1, dy = 0.1},
 {{-dx, 1 + dy}, {.25 - dx/4, 1 + dy}, {.75 + dx/4, 1 + dy}, {1 + dx, 1 + dy},
 {1 + dx, .75 + dy/4}, {1 + dx, .25 - dx/4}, {1 + dx, -dy}, {.75 + dx/4, -dy},
 {.25 - dx/4, -dy}, {-dx, -dy}, {-dx, .25 - dy/4}, {-dx, .75 + dy/4}}];    


tour   = Reverse @ FindShortestTour[base, Method -> "CCA"][[2]];
rots   = NestList[RotateLeft, base[[tour]], 11];
metric = Tr @ MapThread[EuclideanDistance, {#, end}] &;
best   = First @ Ordering[metric /@ rots, {1}];
start  = rots[[best]];
nums   = RotateLeft[Range[12][[tour]], best - 1];


Graphics[{
  Lighter @ Orange, 
  Polygon[{{0, 0}, {1, 0}, {1, 1}, {0, 1}}], 
  {Black, Line @ Transpose[{start, end}]},
  {AbsolutePointSize[18], Point[end]},
  {Black, MapThread[Text, {nums, end}]}},
 Frame -> True,
 FrameTicks -> None,
 PlotRange -> {{-.2, 1.2}, {-.2, 1.2}}
]

I also used total line length (Tr). You can experiment with other quality tests such as Mean, Median, Max, etc. Sometimes one of these others, especially Max, seems to give a more aesthetic layout.

This should now work as I intended on version 8. Note that some crossings remain:

Mathematica graphics

$\endgroup$
7
  • $\begingroup$ Interesting, I tried your solution with "my" random points and it gets one crossing line. I think anyway that this looks nicer than mine. Something else is that labels are not sorted, but adding it wouldn't be much more work. $\endgroup$
    – FJRA
    Commented Feb 22, 2012 at 1:17
  • $\begingroup$ @FJRA I admit I chose a good looking sample. I am sure there will be some crossings. Still I think this is different and potentially useful method. $\endgroup$
    – Mr.Wizard
    Commented Feb 22, 2012 at 1:40
  • $\begingroup$ Yes, and solving in an elegant way the crossing lines should be next Szabolcs question :). $\endgroup$
    – FJRA
    Commented Feb 22, 2012 at 1:43
  • $\begingroup$ @FJRA could you give me "your" random points please? I'd like to see how my method performs with some adjustments. $\endgroup$
    – Mr.Wizard
    Commented Feb 22, 2012 at 1:44
  • $\begingroup$ Sure! {{0.55982, 0.812151}, {0.035458, 0.472234}, {0.936164, 0.42964}, {0.194451, 0.0983938}, {0.582078, 0.55705}, {0.393611, 0.142285}, {0.039996, 0.254498}, {0.735887, 0.202454}, {0.893022, 0.762304}, {0.0935256, 0.767854}, {0.849199, 0.334092}, {0.202145, 0.536306}} $\endgroup$
    – FJRA
    Commented Feb 22, 2012 at 1:50
7
$\begingroup$

Here is an implementation using the angle of the point. Using FJRA's random points generation method:

In[67]:= start = RandomReal[{0, 1}, {12, 2}]

Out[67]= {{0.957578, 0.49789}, {0.984345, 0.872682}, {0.250315, 
  0.542327}, {0.811817, 0.60049}, {0.65166, 0.79753}, {0.891558, 
  0.125237}, {0.42729, 0.602176}, {0.297289, 0.440565}, {0.673284, 
  0.503713}, {0.587548, 0.249505}, {0.135377, 0.138527}, {0.0435007, 
  0.827718}}

We first need to normalize the data. Note that it matters where the center of your main graphic is. Because of the points I've chosen, I have normalised on {0.5,0.5}

In[68]:= step1 = Normalize /@ ( # - {0.5, 0.5} & /@ start)

Out[68]= {{0.999989, -0.00461163}, {0.792538, 0.609822}, {-0.985933, 
  0.167139}, {0.951795, 0.306736}, {0.454136, 
  0.890933}, {0.722431, -0.691443}, {-0.579794, 
  0.814763}, {-0.959603, -0.281357}, {0.999771, 
  0.0214221}, {0.32993, -0.944006}, {-0.710168, -0.704032}, \
{-0.812345, 0.583178}}

Verifying the normalisation

In[69]:= Norm /@ step1

Out[69]= {1., 1., 1., 1., 1., 1., 1., 1., 1., 1., 1., 1.}

Now, work out the angle of the points relative to the center of the graphic and re-order the points accordingly:

   In[70]:= step2 = start[[Ordering[ArcTan @@@ step1] ]]

Out[70]= {{0.297289, 0.440565}, {0.135377, 0.138527}, {0.587548, 
  0.249505}, {0.891558, 0.125237}, {0.957578, 0.49789}, {0.673284, 
  0.503713}, {0.811817, 0.60049}, {0.984345, 0.872682}, {0.65166, 
  0.79753}, {0.42729, 0.602176}, {0.0435007, 0.827718}, {0.250315, 
  0.542327}}

Re-order the positions of the end-points the same way

In[73]:= end2 = end[[Ordering[ArcTan @@@ end] ]]

Out[73]= {{-0.1, -0.1}, {0.225, -0.1}, {0.775, -0.1}, {1.1, -0.1}, \
{1.1, 0.225}, {1.1, 0.775}, {1.1, 1.1}, {0.775, 1.1}, {0.225, 
  1.1}, {-0.1, 1.1}, {-0.1, 0.775}, {-0.1, 0.225}}

And here is the graphic:

Graphics[{FaceForm[Lighter@Orange], 
  Polygon[{{0, 0}, {1, 0}, {1, 1}, {0, 1}}], 
  Line@Transpose[{step2, end2}], AbsolutePointSize[18], 
  Lighter@Orange, Point[end2], Black, 
  MapThread[Text, {Range[12], end2}]}, Frame -> True, 
 FrameTicks -> None, PlotRange -> {{-.2, 1.2}, {-.2, 1.2}}]

enter image description here

It's not perfect, particularly if the arrangement of points is quite bunched, but it avoids most crossings. There might be a way to refine it based on the distance between the angles, butjust ordering the angles works pretty well.

$\endgroup$
1
  • 1
    $\begingroup$ My earlier version used ArcCos instead of ArcTan. That was a complete brain failure and my only excuse is that we don't use trigonometry much in economics. $\endgroup$
    – Verbeia
    Commented Feb 22, 2012 at 2:58
6
$\begingroup$

This is a nice problem.

I get this solution:

Initialization:

start = RandomReal[1, {12, 2}];
end = With[{dx = 0.1, 
    dy = 0.1}, {{-dx, 1 + dy}, {.25 - dx/4, 1 + dy}, {.75 + dx/4, 
     1 + dy}, {1 + dx, 
     1 + dy}, {1 + dx, .75 + dy/4}, {1 + dx, .25 - dx/4}, {1 + 
      dx, -dy}, {.75 + dx/4, -dy}, {.25 - 
      dx/4, -dy}, {-dx, -dy}, {-dx, .25 - dy/4}, {-dx, .75 + dy/4}}];
labels = Range[12];

Then build a matrix of distances between starts and ends, and take the min values of distances to choose the new order:

matrixDistances = Table[Norm[a - b], {a, start}, {b, end}];
tempmatrix = matrixDistances;
neworder = Table[
  With[{pos = First[Position[tempmatrix, Min[tempmatrix]]]},
   tempmatrix[[pos[[1]], All]] = \[Infinity];
   tempmatrix[[All, pos[[2]]]] = \[Infinity];
   pos
   ],
  {i, 12}
  ]

Then the graphic is ready to be done:

Graphics[{FaceForm[Lighter@Orange], 
  Polygon[{{0, 0}, {1, 0}, {1, 1}, {0, 1}}], 
  Line@Transpose[{start[[neworder[[All, 1]]]], 
     end[[neworder[[All, 2]]]]}], AbsolutePointSize[18], 
  Lighter@Orange, Point[end], Black, 
  MapThread[
   Text, {labels[[neworder[[All, 1]]]], end[[neworder[[All, 2]]]]}]}, 
 Frame -> True, FrameTicks -> None, 
 PlotRange -> {{-.2, 1.2}, {-.2, 1.2}}]

enter image description here

By the way, without sorting the points you would have get this:

enter image description here

$\endgroup$
2
  • $\begingroup$ It looks very nice! But exchanging 2 <-> 10 and 4 <-> 6 might look better (haven't actually tried yet, so I am not sure, but it would eliminate the crossing). I wonder if it's possible to improve on it. (It's very late now, I'll have to look over your code tomorrow and figure out how you took the min values since there's more than one possibility) $\endgroup$
    – Szabolcs
    Commented Feb 21, 2012 at 22:09
  • $\begingroup$ Yes, exchanging them would be much better... I will try to think about doing it in a simple way. $\endgroup$
    – FJRA
    Commented Feb 22, 2012 at 1:07

Your Answer

By clicking “Post Your Answer”, you agree to our terms of service and acknowledge you have read our privacy policy.

Not the answer you're looking for? Browse other questions tagged or ask your own question.