5
$\begingroup$

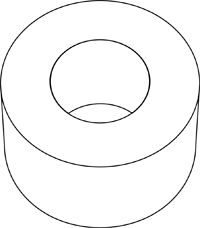
I would like to have that kind of cylinder with Dashed edges (including the bellow inner ring):

Edged Cylinder

I've been trying that:

opt = {Mesh -> None, PlotStyle -> {Lighter@Black, Opacity[0.3]}}; 
Show[{
ParametricPlot3D[{r Cos@th,r Sin@th,#},{th, 0, 2 Pi},{r, 0.3, 0.31},Evaluate@opt] &/@ {0,2}, 
ParametricPlot3D[{# Cos@th,# Sin@th,z},{th, 0, 2 Pi},{z, 0, 2},Evaluate@opt] & /@ {.3, .31}} 
,PlotRange -> All, Axes -> False, Boxed -> False, ViewVertical -> {1, 0, 0}]

But I can't find out how to dash the edges.

According to that answer I've been trying that:

tube = ParametricPlot3D[2 {Cos[t], Sin[t], u}, {t, 0, 2 Pi}, {u, -5, 5}, 
                         Mesh -> None, PlotStyle -> {Opacity[0]}];
tube /. Polygon[a__] :> {EdgeForm[{Dashed}], Mesh -> All, Polygon[a]}

But it only dashes the mesh:

Mathematica graphics

And belisarius has been trying that:

RegionPlot3D[1 < x x + y y < 2 && -2 < z < 2, {x, -2, 2}, {y, -2, 2}, {z, -1/2, 1/2},
             Mesh -> False, BoundaryStyle -> Directive[Red, Thick, Dashed],
             BoxRatios -> {1, 1, 1/5}, Boxed -> False, Axes -> False] 

Which doesn't give the transparency:

Mathematica graphics

Thus, my question is: is it possible to construct the first picture cylinder with Dashed Edges?

$\endgroup$

2 Answers 2

12
$\begingroup$

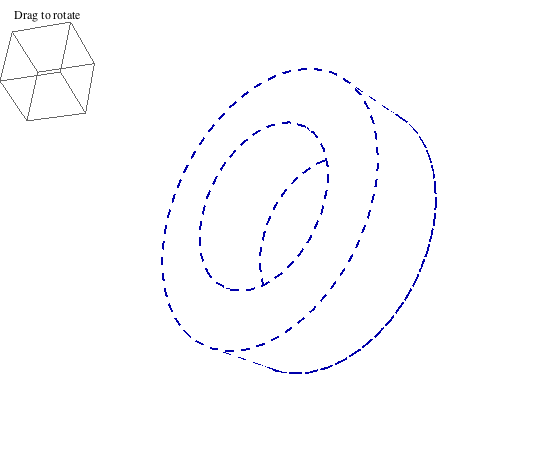
I once wrote something to highlight the edge of graphs of $z = f(x,y)$. The key is to notice that the property of an edge is that the surface normal is orthogonal to the direction from the view point. One can construct a function for MeshFunctions that will draw the edge. The result is pretty good, but sometimes the edge lines seem thinner. I thought it might be the surface partially obscuring them.

Below the outline is updated dynamically as the little box is rotated. Because the outline is recreated when it is rotated, it cannot be rotated directly (it destroys itself when you try -- well, more precisely, the graphic being rotated is replaced by a new one).

The mesh function is parametricFaceCosine, which returns the CosineDistance of the surface normal and the vector from the view point to the point on the graph. This is equal to 1 when the vectors are orthogonal. I used the value 0.95, which draws the mesh lines slightly in front.

radius1 = 3; radius2 = 5; height = 3;
parametricFaceCosine[f_, viewPoint_] :=  (* assumes f is a function of s, t !! *)
  Function[{xx, yy, zz, ss, tt}, 
   CosineDistance[D[f, s]\[Cross]D[f, t] /. {s -> ss, t -> tt},
    {xx - viewPoint[[1]], yy - viewPoint[[2]], zz - viewPoint[[3]]}]];

DynamicModule[{viewVec, vert, caps, corners},
 With[{f1 = {radius1 Cos[t], radius1 Sin[t], s}, 
   f2 = {radius2 Cos[t], radius2 Sin[t], s}},

  viewVec = {Max[2 radius2, height] {1.3, -2.4, 2}, Scaled[{0.5, 0.5, 0.5}]};
  vert = {0, 0, 1};
  caps = RegionPlot3D[radius1^2 <= x^2 + y^2 <= radius2^2 && (z == 0 || z == height),
   {x, -radius2, radius2}, {y, -radius2, radius2}, {z, 0, height}, 
   PlotStyle -> White, BoundaryStyle -> Directive[AbsoluteDashing[8], Darker@Blue, Thick],
   Mesh -> None, NormalsFunction -> None (* for speed *)];

  Row[{
    Graphics3D[{}, (* rotation control *)
     ViewVector -> Dynamic[viewVec], ViewVertical -> Dynamic[vert], 
     PlotLabel -> "Drag to rotate", BaselinePosition -> Top],

    Dynamic@Show[ (* cylinder *)
      ParametricPlot3D[{f1, f2}, {s, 0, height}, {t, 0, 2 \[Pi]}, 
       PlotPoints -> {2, 15}, PlotStyle -> White, 
       BoundaryStyle -> None,
       Mesh -> {{0.95}}, (* edge is exactly at 1; 0.95 is slightly in front *)
       MeshFunctions -> {parametricFaceCosine[f1, viewVec[[1]]]}, 
       MeshStyle -> Directive[AbsoluteDashing[8], Darker@Blue, Thick],
       NormalsFunction -> None (* for speed *)],
      caps,
      Axes -> None, Boxed -> False, Lighting -> {{"Ambient", White}},
      ViewVector -> Dynamic[viewVec], ViewVertical -> Dynamic[vert], 
      BoxRatios -> Automatic, SphericalRegion -> True, 
      ImageSize -> 450, BaselinePosition -> Top
      ]
    }]
  ], SaveDefinitions -> True]
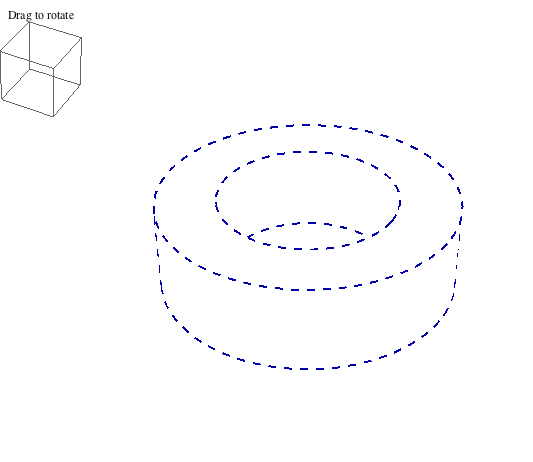
Cylinder Rotate cylinder

$\endgroup$
6
  • $\begingroup$ The graphics go crazy for a slender beam, but I assume this is the best which can be done. Thanks! $\endgroup$
    – Öskå
    Commented Mar 10, 2013 at 22:31
  • $\begingroup$ @Öskå The first element of viewVec is the viewpoint in the coordinate system of the graphics. It needs to be far enough away from the object. I've improved it. One often has to tweak it for the job at hand. $\endgroup$
    – Michael E2
    Commented Mar 10, 2013 at 22:48
  • $\begingroup$ @MichaelE2 View point is much better! :) $\endgroup$
    – Öskå
    Commented Mar 10, 2013 at 23:10
  • $\begingroup$ (+1) same approach should work for this question? $\endgroup$
    – kglr
    Commented Mar 11, 2013 at 10:53
  • $\begingroup$ @kguler Thanks, I hadn't thought of that. I've posted an answer. Not quite as nice as I'd like, but serviceable. $\endgroup$
    – Michael E2
    Commented Mar 11, 2013 at 20:12
4
$\begingroup$

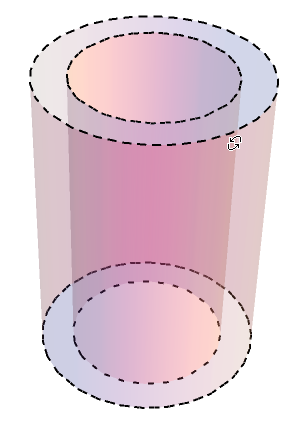
Play with numbers in AbsoluteDashing to get what you need.

RegionPlot3D[
 1 < x x + y y < 2 && -3 < z < 3, {x, -2, 2}, {y, -2, 2}, {z, -2, 2}, 
 Mesh -> False, 
 BoundaryStyle -> Directive[AbsoluteDashing[{5, 10}], Thick], 
 BoxRatios -> Automatic, Boxed -> False, Axes -> False, 
 PlotStyle -> Opacity[.2]]

enter image description here

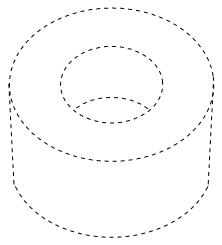
Note vertical lines are not really edges in 3D - so you cannot dash them easily in 3D. In 2D though it be easy.

Graphics[{
  {Dashed, Circle[{0, 0}, {4, 3}]},
  {Dashed, Circle[{0, 0}, {2, 1.5}]},
  {Dashed, Circle[{0, -2}, {2, 1.5}, {Pi/4, Pi - Pi/4}]},
  {Dashed, Circle[{0, -3}, {4, 3}, {Pi + Pi/9, 2 Pi - Pi/9}]},
  {Dashed, Line[{{-3.8, -3.9}, {-4, 0}}]},
  {Dashed, Line[{{3.8, -3.9}, {4, 0}}]}
  }]

enter image description here

$\endgroup$
7
  • $\begingroup$ ah, the only problem in this answer is that you can't have the Z axis horizontally due to the 2D graphic.. $\endgroup$
    – Öskå
    Commented Mar 10, 2013 at 16:54
  • $\begingroup$ Vitaliy, in version 7 the dashing in the first graphic is very irregular. Do you know of a simple way to fix that? $\endgroup$
    – Mr.Wizard
    Commented Mar 10, 2013 at 18:27
  • $\begingroup$ @Öskå I am not sure I understand. You can redraw 2D projection of a 3D object any way you need. $\endgroup$ Commented Mar 10, 2013 at 19:04
  • $\begingroup$ You can indeed redraw it the way u want it. The idea here was to have the same render in 3D :) $\endgroup$
    – Öskå
    Commented Mar 10, 2013 at 19:14
  • $\begingroup$ @Öskå so 1st version doesn't work for you? $\endgroup$ Commented Mar 10, 2013 at 19:20

Your Answer

By clicking “Post Your Answer”, you agree to our terms of service and acknowledge you have read our privacy policy.

Not the answer you're looking for? Browse other questions tagged or ask your own question.