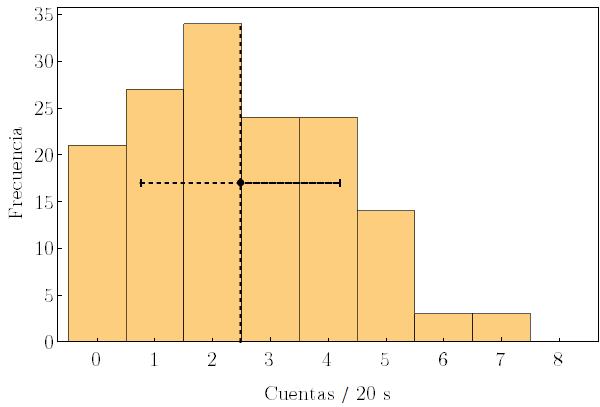
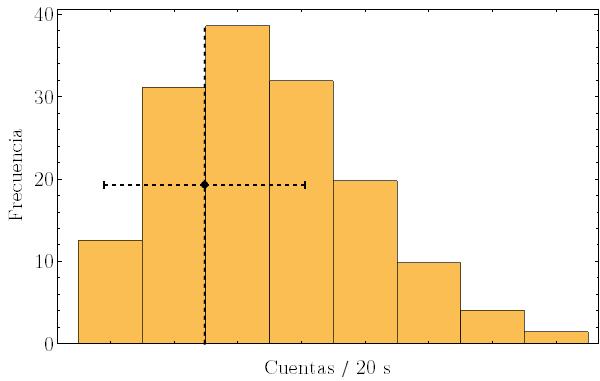
I want to plot an overlapped graphic comparing the experimental and theoretical data of the number of counts in a given time (beta decay), so I show them in a histogram.
Because of sometimes the number of counts is 0, the experimental histogram has a bin centered at 0.
v = ListPlot[{{Around[M, S], 34/2}}, PlotStyle -> {Dashed, Thick, Black}];
l = Graphics[{Dashed, Thick, {Line[{{M, 0}, {M, 34}}], Line[{{M - S, 34/2}, {M + S, 34/2}}]}}];
h = Histogram[t, Frame -> True,  FrameLabel -> {"Cuentas / 20 s", "Frecuencia"},  FrameStyle ->    Directive[GrayLevel[0], 20, FontFamily -> "LM Roman 12",     AbsoluteThickness[1.0`]],  ImageSize -> 600,  FrameTicks -> {{Table[i, {i, 0, 35, 5}],      None}, {Table[i, {i, 0, 8}], None}},[![enter image description here][1]][1]  PlotRange -> {{-0.5, 8.5}, Automatic}]
m1 = Show[h, l, v]
The problem appears when I build the theortical plot. I have a list of calculated heights of the bins (included 0 counts), so I use a BarChart
B = BarChart[Fteor, BarSpacing -> None, Frame -> True,   FrameLabel -> {"Cuentas / 20 s", "Frecuencia"},   FrameStyle ->
Directive[GrayLevel[0], 20, FontFamily -> "LM Roman 12",
 AbsoluteThickness[1.0`]],   ImageSize -> 600];
A = ListPlot[{{Around[M, J], Max[Fteor]/2}}, PlotStyle -> {Dashed, Thick, Black}];
G = Graphics[{Dashed, Black, Thick, Line[{{M, 0}, {M, Max[Fteor]}}]}];[![enter image description here][1]][1]

m2 = Show[B, A, G]
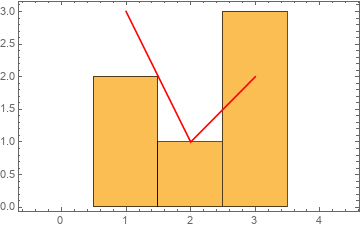
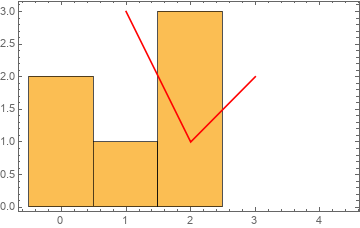
And if I combine them:
Show[m1,m2]
As you can see, the theoretical BarChart put the first bin (0 events) at position 1. I also have added other graphics to view the experimental and theoretical standard deviation and mean of distribution (Variables S, J, M, respectively) so I don't want to edit the rest of elements, only BarChart (for simplicity).
Is there a simple way to tell Mathematica to put the first bin of a BarChart centered at 0 instead of 1?
P.S.: I have already seen solutions of creating Rectangles with given height and position, but I am looking for a simple solution with BarChart (if it is posible)
Thanks! Dani


Histograminstead ofBarChart- this way, you get the same look for free. You can supply the data toHistogramasWeightedData[xlist,ylist], wherexlistis the bin position, andylistis the bin height $\endgroup$