2
$\begingroup$

Following this example, I though it would be as easy as this:

Plot3D[1/(x^2 + 1) + 1/(y^2 + 1), {x, -10, 10}, {y, -10, 10}, 
MeshStyle -> {Black, Black, Red, Green}, Mesh -> {20, 20, 20, 20}, 
MeshFunctions -> {# &, #2 &, If[# == 5, #] &, If[#2 == 5, #2] &}]

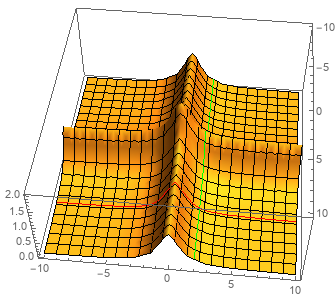
However, this shows only the black mesh. I played around with the number parameter in Mesh-> But that didn't help. How can I draw a red/green line over the plot at a certain x or y position?

$\endgroup$

1 Answer 1

4
$\begingroup$
Plot3D[1/(x^2 + 1) + 1/(y^2 + 1), {x, -10, 10}, {y, -10, 10}, 
 MeshStyle -> {Black, Black, Red, Green}, Mesh -> {20, 20, {5}, {2}}, 
 MeshFunctions -> {# &, #2 &, # &, #2 &}]

enter image description here

Alternatively, you can specify the mesh divisions for the third and fourth mesh functions as lists of {division, style} pairs:

Plot3D[1/(x^2 + 1) + 1/(y^2 + 1), {x, -10, 10}, {y, -10, 10}, 
 MeshStyle -> Black, Mesh -> {20, 20, {{5, Red}}, {{2, Green}}}, 
 MeshFunctions -> {# &, #2 &, # &, #2 &}]

same picture

$\endgroup$
1
  • $\begingroup$ Sometimes it can be as easy as that $\endgroup$ Commented Sep 25, 2019 at 18:35

Your Answer

By clicking “Post Your Answer”, you agree to our terms of service and acknowledge you have read our privacy policy.

Not the answer you're looking for? Browse other questions tagged or ask your own question.