5
$\begingroup$

Context

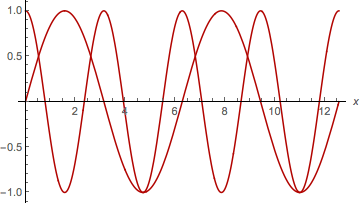
More often than not I end up doing plots one after the other so that I have a set of plots with the same colour style. When I want to make it more publishable ready, I would like to reassign colours to each line.

How to assign colours from a given style to existing sets of plots?

Example

pl1= Plot[Sin[x],{x,0,4Pi}];
pl2= Plot[Cos[2x],{x,0,4Pi}];
Show[pl1,pl2];
Mathematica graphics

Attempt

I while back I wrote the following function

Clear[ShowColor];
ShowColor[list___]:=ShowColor[{list}]/; Length[{list}]>1;
ShowColor[list_,ColorRange->color__,opt___]:= Module[{len=Length[list]},
     Table[list[[i]] /. RGBColor[_,_,_]->
          GradientColor[color][(i-1)/(len-1)],{i,len}]//Show[#,opt]&]
ShowColor[list_,opt___]:= Module[{len=Length[list]},
     Table[list[[i]] /. RGBColor[_,_,_]->
          GradientColor[ColorData[10] /@ Range[10]][(i-1)/(len-1)],{i,len}]//Show[#,opt]&]

which uses the GradientColor Package, so that

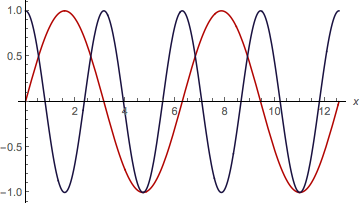
ShowColor[{pl1,pl2}]

produces
Mathematica graphics

But I am left with the impression that it could be done more elegantly and generally with the modern version of Mathematica, making use of the set of default styles and working in harmony with other features.

Also, my implementation is not very robust. For instance,

 Show[pl1, pl2] // ShowColor 

fails.

What would be great would be to have a function which e.g. would take standard Options such as

 ShowColor[plots,PlotStyle-> ColorData[10]]

or

  ShowColor[plots,PlotStyle-> Directive[{Dashed,Blue}]]

Any suggestion on how to make this as generic as possible?

Thanks!

$\endgroup$
2
  • $\begingroup$ you might find this interesting. $\endgroup$
    – kglr
    Commented Jul 1, 2019 at 17:08
  • $\begingroup$ thanks for the link $\endgroup$
    – chris
    Commented Jul 1, 2019 at 17:15

2 Answers 2

7
$\begingroup$

Using DLichti's ingenious idea / function from this q/a:

dLichtiIncrement[n0_Integer: 0, n1_Integer: 0, f_Function: Identity] := 
  Module[{N0 = n0, N1 = n1}, (If[# <= N1, N0 = N0 + N1]; N1 = #; f[N0 + #]) & ]

to define a function color which increments the color every time it is invoked as color[1]:

ClearAll[color, reColor]
color = dLichtiIncrement[(ColorData[97][#] &)];
reColor[] = # /. _?ColorQ :> color[1] &;
reColor[_] := Module[{}, ClearAll[color]; 
  color = dLichtiIncrement[(ColorData[97][#] &)]; reColor[]]

Examples:

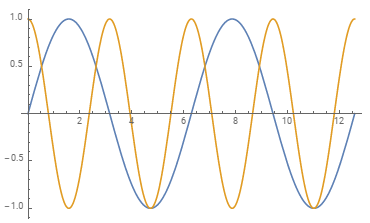
pl1 = Plot[Sin[x], {x, 0, 4 Pi}];
pl2 = Plot[Cos[2 x], {x, 0, 4 Pi}];
Show[pl1, pl2]//reColor[]

enter image description here

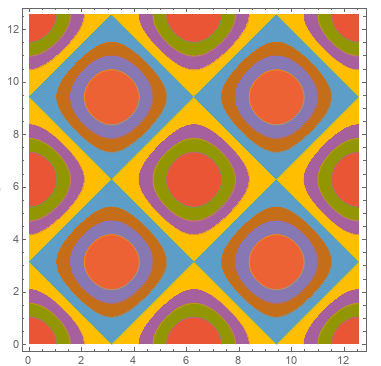
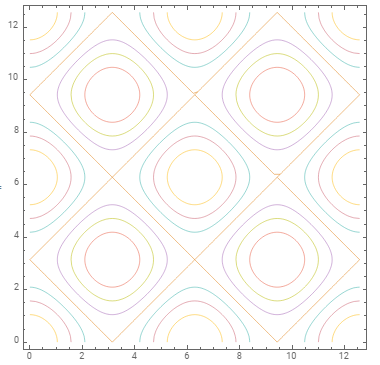
ContourPlot[Cos[x] + Cos[y], {x, 0, 4Pi}, {y, 0, 4Pi}] // reColor[]

enter image description here

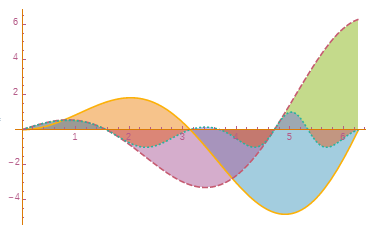
Plot[{x Sin[x], x Cos[x], Sin[x Cos[x]]}, {x, 0, 2 Pi}, 
  PlotTheme -> "Monochrome", Filling -> Axis, FillingStyle -> Opacity[.5]] // reColor[]

enter image description here

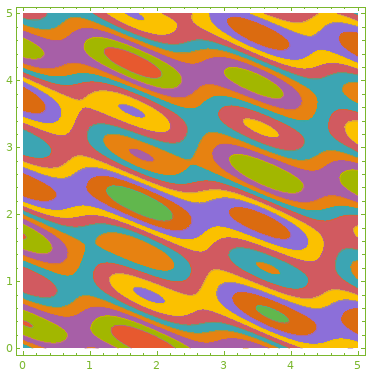
ContourPlot[Evaluate[Sum[Sin[RandomReal[5, 2].{x, y}], {5}]], {x, 0, 5}, {y, 0, 5},
 PlotTheme -> "Monochrome"] // reColor[]

enter image description here

 ContourPlot[Cos[x] + Cos[y], {x, 0, 4 Pi}, {y, 0, 4 Pi},
    ContourShading -> False] // reColor[]

enter image description here

You can also use color[1] in setting ChartStyle/PlotStyle:

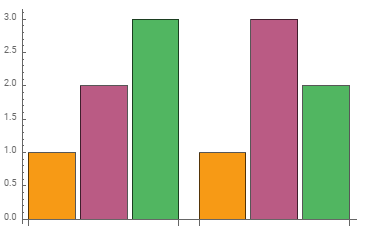
BarChart[{{1, 2, 3}, {1, 3, 2}}, ChartStyle -> Table[color[1], 3]]

enter image description here

Using reColor[blah] @ Red resets color[1] to its initial state:

 reColor[blah] @ Red == ColorData[97][1]

True

$\endgroup$
5
  • $\begingroup$ This is almost perfect: would it be possible to give reColor an argument to allow for the colours to reincrement from the beginning? I.e. plots//reColor[] would yield the same sets of colours ? $\endgroup$
    – chris
    Commented Jul 1, 2019 at 18:35
  • $\begingroup$ @chris, i made small changes to allow resetting: regular call is reColor[] and reColor[anything] resets color to its initial definition. $\endgroup$
    – kglr
    Commented Jul 1, 2019 at 19:28
  • 1
    $\begingroup$ Great ! I modified it slightly to choose the ColourTable: ClearAll[color, reColor] color = dLichtiIncrement[(ColorData[10][#] &)]; reColor[] = # /. _?ColorQ :> color[1] &; reColor[val_: 10] := Module[{}, ClearAll[color]; color = dLichtiIncrement[(ColorData[val][#] &)]; reColor[]] $\endgroup$
    – chris
    Commented Jul 1, 2019 at 20:08
  • $\begingroup$ The only remaining question is : are you nostalgic of the 70ies ? :-) $\endgroup$
    – chris
    Commented Jul 2, 2019 at 8:36
  • $\begingroup$ ... those were the days:) $\endgroup$
    – kglr
    Commented Jul 2, 2019 at 13:55
4
$\begingroup$

A simple way is to pass the coordinates in the plots to ListLinePlot.

recolor[plot_, opts___] := ListLinePlot[
  Cases[plot, Line[coords_] :> coords, Infinity],
  opts
  ]

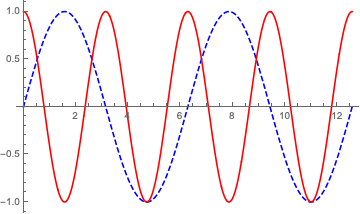
Show[
 recolor[pl1, PlotStyle -> Directive[Blue, Dashed]],
 recolor[pl2, PlotStyle -> Red]
 ]

Mathematica graphics

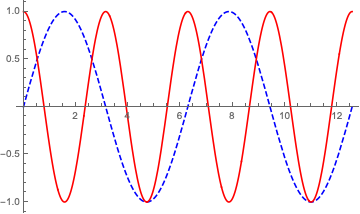
It can also be used to recolor already combined plots:

recolor[
 Plot[{Sin[x], Cos[2 x]}, {x, 0, 4 Pi}],
 PlotStyle -> {
   Directive[Blue, Dashed],
   Red
   }]

Mathematica graphics

And it also works on this:

recolor[pl3=Show[pl1, pl2],
 PlotStyle -> {
   Directive[Blue, Dashed],
   Red
   }]

You can also use existing themes:

  recolor[pl3, PlotTheme -> "Detailed"]

Mathematica graphics

$\endgroup$
2
  • $\begingroup$ @chris that's always a good idea, you never know what someone might come up with. $\endgroup$
    – C. E.
    Commented Jul 1, 2019 at 16:56
  • 1
    $\begingroup$ Thanks again for your solution: I would have accepted both if I could. $\endgroup$
    – chris
    Commented Jul 2, 2019 at 13:58

Your Answer

By clicking “Post Your Answer”, you agree to our terms of service and acknowledge you have read our privacy policy.

Not the answer you're looking for? Browse other questions tagged or ask your own question.