2
$\begingroup$

Whenever I try to use FindFit or NonlinearModelFit for the data (shown below), I keep getting the following error thrown at me:

RecursionLimit::reclim: Recursion depth of 1024 exceeded.

I am using an exponential model to try and fit it.

data = {0.19676778483499557`, 0.20885602228466532`, 0.22210833221738427`, 
0.23668665287868895`, 0.252783561788831`, 0.2706298263857738`, 
0.2905043053747535`, 0.3127471056565888`, 0.3377773233068993`, 
0.3661173611964135`, 0.39842687921844677`, 0.43555118981628316`, 
0.4785919073537348`, 0.5290129571413393`, 0.5888048389535786`, 
0.6607490640587161`};

The particular model that I'm using is FindFit[data, Exp[a*x] + b, {a, b}, x]

How can I stop getting this error thrown at me/get the model I'm trying to use to work?

$\endgroup$
5
  • $\begingroup$ Can you give the exact command you used to fit please? Otherwise it's difficult to tell what's going on. But as a first guess I'd suggest you try again with a fresh kernel. $\endgroup$
    – Roman
    Commented May 17, 2019 at 12:51
  • $\begingroup$ @Roman Updated the question. $\endgroup$
    – STDK
    Commented May 17, 2019 at 12:55
  • 2
    $\begingroup$ Runs fine on my computer. Please try your own code with a fresh kernel. Check ?a and ?b to see if there are any lingering definitions. $\endgroup$
    – Roman
    Commented May 17, 2019 at 13:01
  • $\begingroup$ @Roman I took your advice and used a new kernel. Worked just fine. Would you happen to know why using a new kernel worked? $\endgroup$
    – STDK
    Commented May 17, 2019 at 13:21
  • $\begingroup$ Lingering definitions of a and b. Check them with ?a and ?b. $\endgroup$
    – Roman
    Commented May 17, 2019 at 13:30

2 Answers 2

6
$\begingroup$

Try

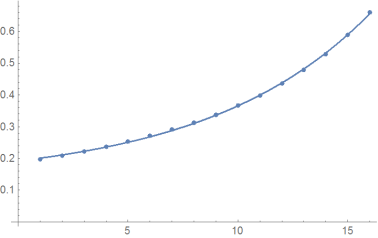
fit = FindFit[data, a + b Exp[c x], {a, b, c}, x]
Show[{ListPlot[data],Plot[a + b Exp[c x] /. fit, {x, 1, Length[data]}]}]

enter image description here

$\endgroup$
3
  • $\begingroup$ Thank you. That worked beautifully! $\endgroup$
    – STDK
    Commented May 17, 2019 at 13:01
  • $\begingroup$ You're welcome. $\endgroup$ Commented May 17, 2019 at 13:02
  • $\begingroup$ Or, equivalently, use Exp[a*x + c] + b for the model. $\endgroup$
    – Bob Hanlon
    Commented May 17, 2019 at 13:20
4
$\begingroup$

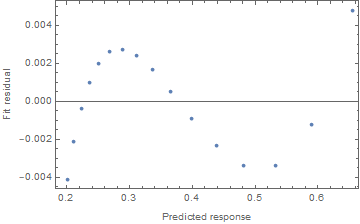
This is just an extended comment. While the fit might "look" good, an examination of the residuals vs the fit shows that there is still a lot more structure that maybe needs explaining:

ListPlot[Transpose[{fit["PredictedResponse"], fit["FitResiduals"]}],
  Frame -> True, FrameLabel -> {"Predicted response", "Fit residual"}]

residuals vs fit

Three (of many) possibilities: (1) underlying curve is more complicated than first thought and (2) the measurement system has a floating bias, (3) the observations are correlated across the predictor variable (maybe that's "time"?).

The point is that to make inferences from regressions certain assumptions need to hold at least approximately. Such residual plots are just one kind of check on those assumptions to see if there are any gross deviations from those assumptions. A residual plot should be mandatory.

$\endgroup$

Your Answer

By clicking “Post Your Answer”, you agree to our terms of service and acknowledge you have read our privacy policy.

Not the answer you're looking for? Browse other questions tagged or ask your own question.