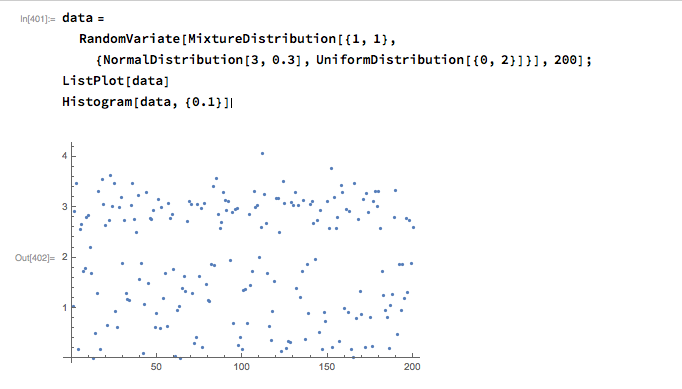
I wanted to get a binned plot that a uniform background distribution with a spike at some bin. My first instinct was to use RandomVariate, and then ListPlot. What i get is this
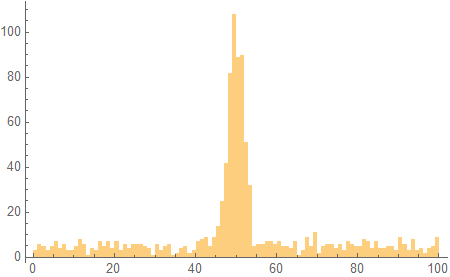
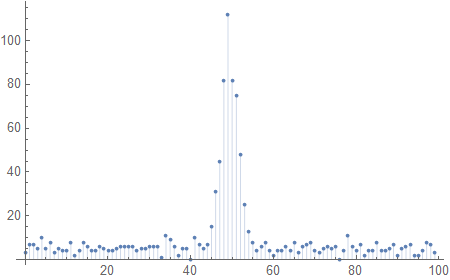
This makes sense as the RandomVariate function is assigning a value to Y based on the distribution. But I was wondering how I would produce a plot that has a spike at some particular bin (some specified x). I would want to produce something that looks more like this, for example.
I know I could just manually enter the data, but is there a way to have a binned plot where there is a uniform background distribution and a gaussian peak at some specific x?


