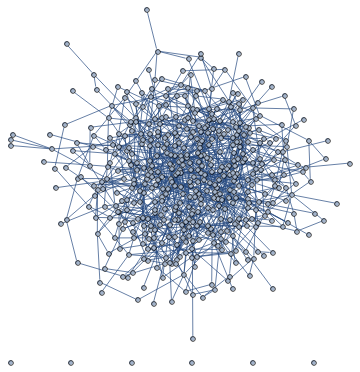
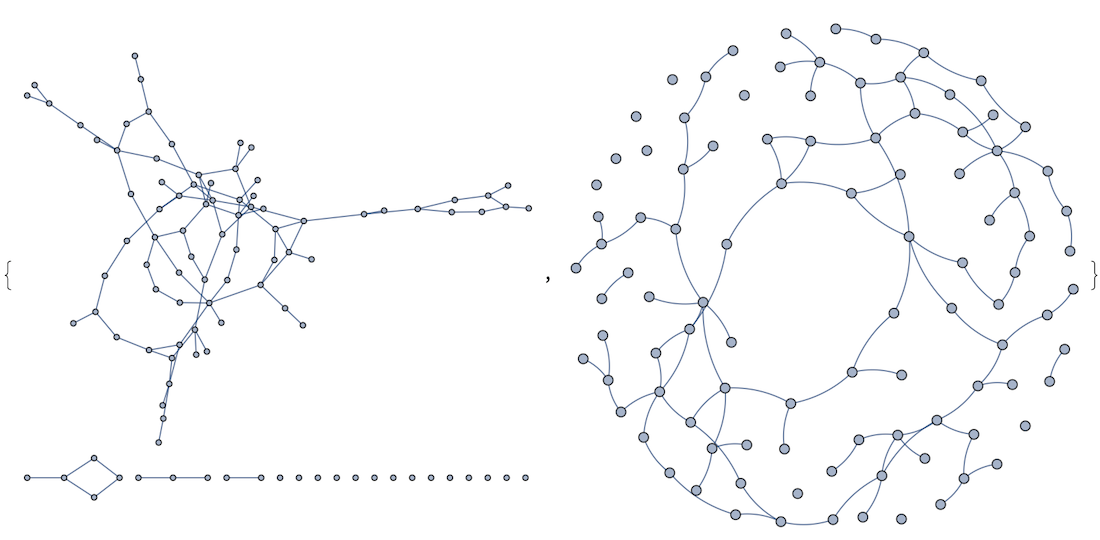
I am trying to figure out a way to include edgeweights in the visualisation of a graph in Mathematica, to find an idea for the drawing such that even for relatively large node numbers the graphs remain visually clear. But the basic built-in feature leads to rather messy layouts as soon as there are large number of nodes/edges. Here's an example below:
SeedRandom[100]
n = 500;
m = 1000;
edgeweights = 1./RandomReal[{0.1, 1}, m];
G = RandomGraph[{n, m}, EdgeWeight -> edgeweights]
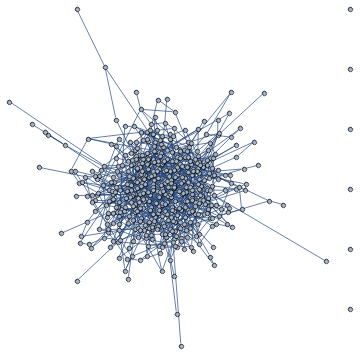
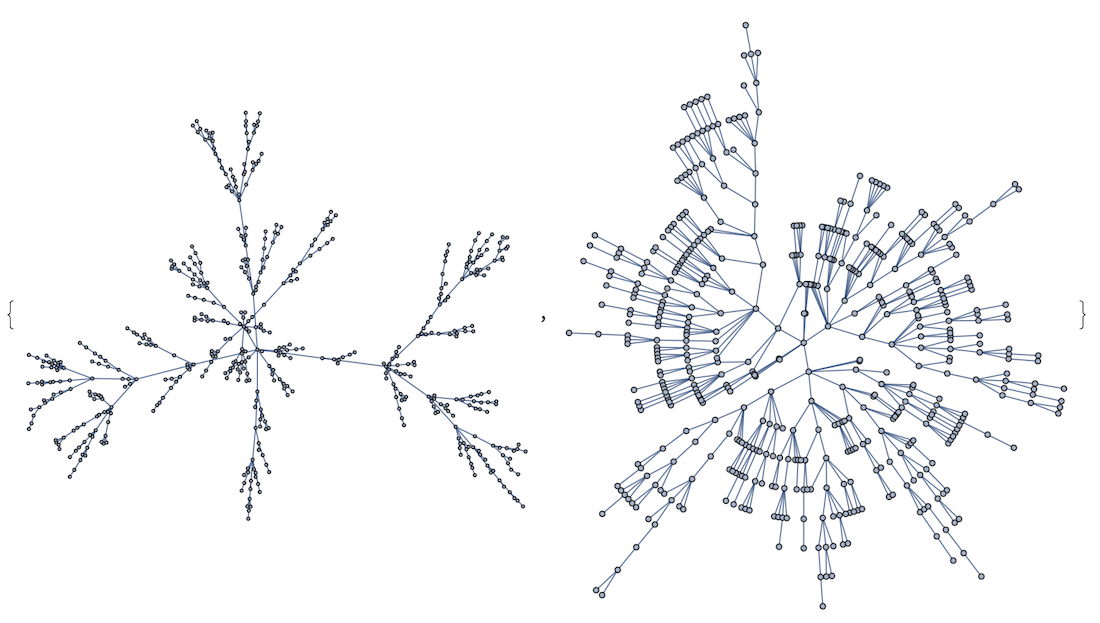
Including GraphLayout -> {"SpringElectricalEmbedding", "EdgeWeighted" -> True} into the definition of G produces:
It seems to simply draw the nodes whose connecting edge weight is larger closer to one another, which leads to a very dense embedded layout.
Would it be possible to:
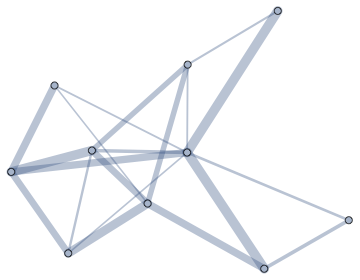
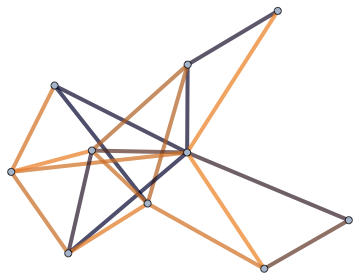
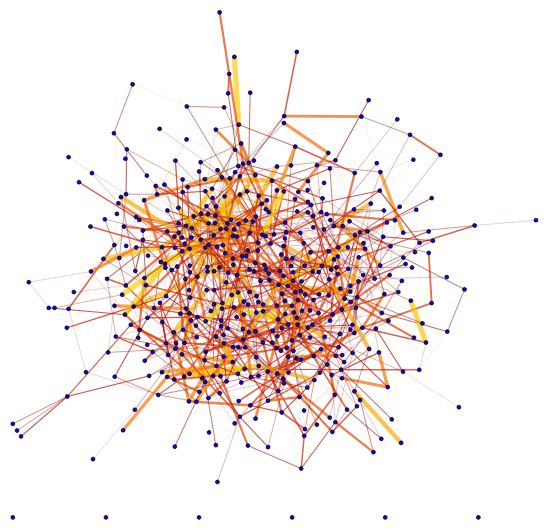
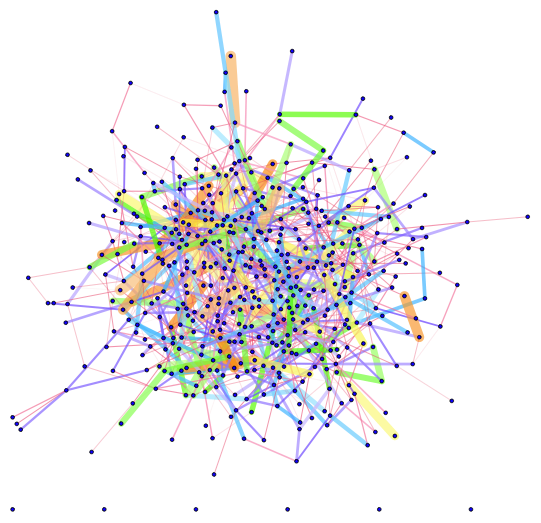
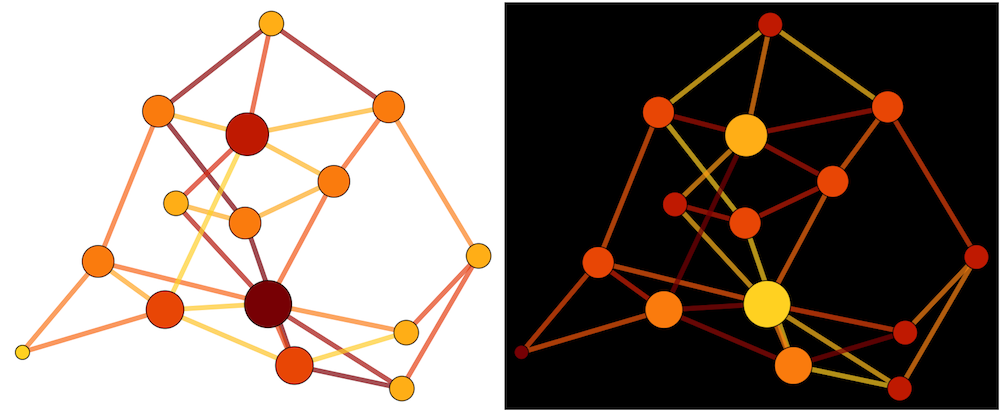
- Modulate the edge thickness and color [*] according to their weights? The weights do not necessarily have to be given in the graph definition (
G), they could also simply be called for the purpose of the visualisation.
[*]: That is, the greater the weight, the thicker and the more brightly colored the edge. For normalization, we can use the maximal weight in the vector of edgeweights.

