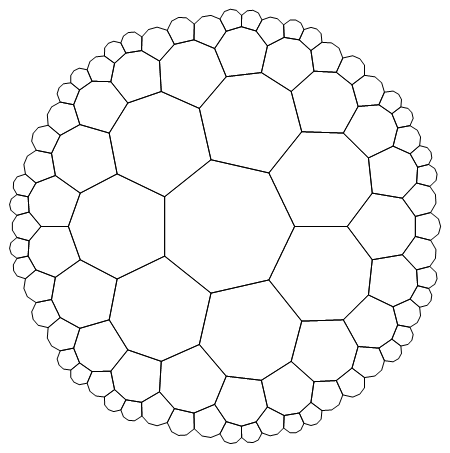
Using some code from http://www.bugman123.com/Hyperbolic/index.html
n = 7; m = 3; dt = 2 Pi/n; dtm = 2 Pi/m; r =
 1.0/(1 - Sin[dt/2]/Cos[dtm/2]); R = r Cos[(dt + dtm)/2]/Cos[dtm/2];
ToMatrix[z_,
   r_] := (I/r) {{z, r^2 - z Conjugate[z]}, {1, -Conjugate[z]}};
alist = Table[
  ToMatrix[r Exp[I t], r - 1], {t, dt/2, 2 Pi, dt}]; Tlist =
 Join[{IdentityMatrix[2]}, alist];
homography[{{a_, b_}, {c_, d_}}, z_] := (a z + b)/(c z + d);
FindT[T0_, Tlist_] :=
  MemberQ[Tlist,
   T_ /; Abs[homography[T, 0] - homography[T0, 0]] < 1.0*^-3];
i2 = 1; Do[i1 = i2 + 1; i2 = Length[Tlist];
 Do[Scan[(T = Tlist[[i]].#;
     If[! FindT[T, Tlist], Tlist = Append[Tlist, T]]) &, alist], {i,
   i1, i2}], {2}];
plot = Show[
  Graphics[Map[
    Line[Table[
       z = homography[#, R Exp[I t]]; {Re[z], Im[z]}, {t, 0, 2 Pi,
        dt}]] &, Tlist], AspectRatio -> Automatic]]

plotFilled = Show[Graphics[
 Map[{RGBColor[RandomReal[], RandomReal[], RandomReal[]],
  Polygon[Table[
    z = homography[#, R Exp[I t]]; {Re[z], Im[z]}, {t, 0, 2 Pi,
     dt}]]} &, Tlist], AspectRatio -> Automatic]]
to make Poincaré hyperbolic tilings
and some code I grab from here
Options[Extrude] =
  Join[Options[Graphics3D], {Closed -> True, Capped -> True}];
Extrude[curve_, {zmin_, zmax_}, opts : OptionsPattern[]] :=
  Module[{info, points, color, tube, caps}, info = Flatten[{curve}];
   points = Select[info, Head[#1] === Line &][[1, 1]];
   If[OptionValue[Closed], points = Join[points, {points[[1]]}]];
   color = Select[info, Head[#1] === Directive &];
   If[Length[color] == 0, color = Orange,
    color = First[Select[color[[1]], ColorQ]]];
   tube = Polygon[
     Partition[
      Flatten[Transpose[(points /. {x_, y_} -> {x, y, #1} &) /@ {zmin,
           zmax}], 1], 3, 1]];
   If[OptionValue[Closed] && OptionValue[Capped],
    caps = (Polygon[points /. {x_, y_} -> {x, y, #1}] &) /@ {zmin,
       zmax}; tube = Flatten[{tube, caps}], tube = {tube}];
   Graphics3D[(Flatten[{color, #1}] &) /@ tube,
    FilterRules[{opts}, Options[Graphics3D]]]];
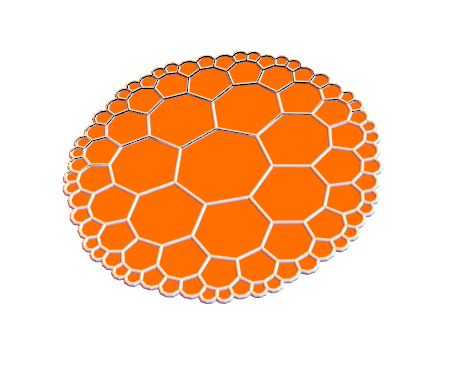
I wanted to make some pretty 3D printed drink coasters:
plotSheet =
 Show[Extrude[#, {-0.01, 0.01}, Capped -> True, Boxed -> False] & /@
   plot[[1]]]
plotTube =
 Graphics3D[{JoinForm["Miter"],
   plot[[1, 2 ;; -1]] /.
    Line[pts_, rest___] :> Tube[Append[#, 0] & /@ pts, 0.05, rest]},
  Axes -> True]
plotFilledSheet = Show[plotSheet, plotTube, PlotRange -> All]
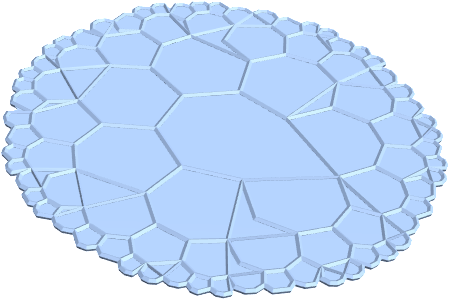
However, when I try to discretize this to make it a filled region, I get
DiscretizeGraphics[plotFilledSheet]
I have also tried simply exporting as an STL but then the tubes around the outer heptagons in the STL are not connected. CAD software then treats it as an open region (surface) and trying to close it lead to awful results.
Saving as an OBJ gave results just like DiscretizeGraphics.
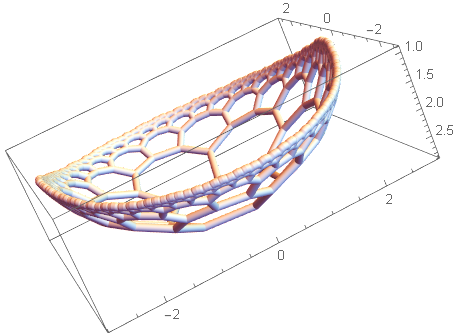
Does anyone have thoughts on how I can get this and the bowl I want to make printed?

