1
$\begingroup$

I am trying to find the way how to represent characteristic function of a single-point set. My idea was to write the points by set:

Ainput = {{2/5, 1/4}};

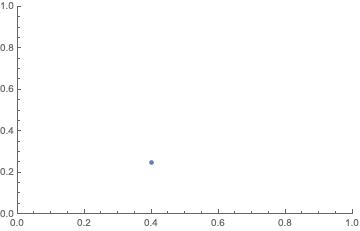
ListPlot[Ainput, PlotRange -> {{0, 1}, {0, 1}}]

enter image description here

Now I want to find a y coordinates for points

{{x -> 2/5}, {x -> 3/5}}

but because I don't have Ainput defined like a function it gives me in both points 0 results instead of 1/4,0. Do you have any suggestions how could I define the function or how could I find the y-coordinate? Thank you.

$\endgroup$
1
  • 1
    $\begingroup$ Could use KroneckerDelta: In[166]:= f[x_] := 1/4*KroneckerDelta[x - 2/5] Map[f, {2/5, 3/5}] Out[167]= {1/4, 0} $\endgroup$ Commented Dec 15, 2018 at 16:00

1 Answer 1

1
$\begingroup$
#[[1, 2]] Boole[x == #[[1, 1]]] &@Ainput /. {{x -> 2/5}, {x -> 3/5}}

{1/4, 0}

Also

Function[x, #[[1, 2]] Boole[x == #[[1, 1]]] &@Ainput] /@ {2/5, 3/5}

{1/4, 0}

$\endgroup$
1
  • $\begingroup$ The OP might be interested in the difference between Function[x, #[[1, 2]] Boole[x == #[[1, 1]]] &@Ainput] /@ {2/5, 2/5 + 10.^-15} and Function[x, #[[1, 2]] Boole[x - #[[1, 1]] == 0] &@Ainput] /@ {2/5, 2/5 + 10.^-15} $\endgroup$
    – Michael E2
    Commented Dec 16, 2018 at 1:49

Your Answer

By clicking “Post Your Answer”, you agree to our terms of service and acknowledge you have read our privacy policy.

Not the answer you're looking for? Browse other questions tagged or ask your own question.