5
$\begingroup$

Suppose I have some two dimensional list. For example:

list = Partition[Range[0, 48], 7];

And I have some function that assigns a colour to each entry of the list, but it takes a long time to execute. For example the following silly function:

f[n_] := With[{val = Mod[FactorInteger[n! + 1][[1, 1]], 3]}, 
val /. {0 -> Blue, 1 -> Green, 2 -> Red}]

This function $f$ calculates $p_n \pmod{3}$, where $p_n$ is the smallest prime factor of $n! + 1$. The specific function however does not matter; the point is that it takes some time to be calculated. I want to draw an image of the list after $f$ is applied to every entry of the list. I can do this with the following piece of code:

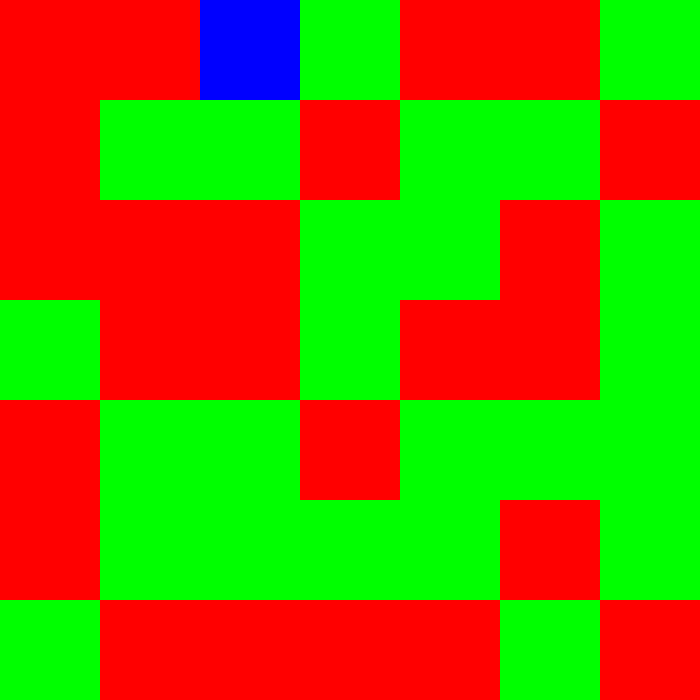
Image[Map[f, list, {2}]]

On my laptop this takes about $31$ seconds. A resized output of this image is the following (but this picture is irrelevant for the question):

enter image description here

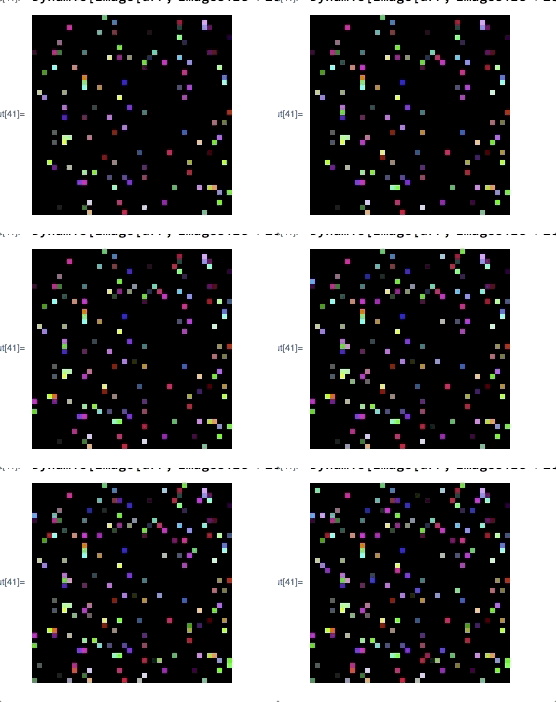
My question is: Is there some way to dynamically draw this picture such that each pixel is immediately drawn after it has been calculated? Maybe such that the pixels that have yet to receive their colour are drawn in another colour, e.g., white, black or grey.

I am interested in this because I am trying to generate images that are quite large for which my function $f$ can take up to hours to completely draw the image. I would like to have some feeling of how much longer it might take and if the correct thing is happening. Ideally the output would change like the following animation.

enter image description here

$\endgroup$

2 Answers 2

5
$\begingroup$

If your data is stored as a matrix or an array, constructing a dynamic image of it is as simple as

arr = ConstantArray[{-1, -1, -1}, {40, 40}];
Dynamic[Image[arr, ImageSize -> 400]

enter image description here

Then run your program and assign the data to the array you already created.

Do[
    Pause @ 0.1;
    Part[arr, Sequence @@ nm] = RandomReal[1, 3];
  ,
    {nm, RandomSample @ Tuples[Range @ 40, {2}]}
  ];

enter image description here

$\endgroup$
3
$\begingroup$

Additionally to what Jason showed (using Dynamic) it's also possible to use Monitor for this.

First let's prepare your input list (with a convenience size parameter side) and in addition prepare an extra result array needed for intermediate result and display purposes.

side = 7;
list = Partition[Range[0, side^2 - 1], side]
result = Array[-1 &, {side, side}]
Dimensions[result] == Dimensions[list]

Now define the function we want to apply to each cell

f[n_] := Mod[FactorInteger[n! + 1][[1, 1]], 3]

colorfun[n_] := Switch[n, 0, Blue, 1, Green, 2, Red, _, Black]

Here we split off the part which is used only for coloring as colorfun.

Monitor[
  Do[result[[j, i]] = f@list[[j, i]], {j, side}, {i, side}],
  MatrixPlot[result, ColorFunctionScaling -> False, ColorFunction -> colorfun]
]

This will update the result cells sequentially in a similar way to what you did with Map[,{2}] before. It's not very beautiful compared to a map but necessary so that Monitor can catch our intermediate results. Monitor will now display a continuously updated MatrixPlot of our result matrix while using our custom ColorFunction.

Curious Addendum from my side: the updating sadly doesn't seem to work when using ParallelDo instead of Do. Does anybody have an idea to make that happen?

$\endgroup$
1
  • 1
    $\begingroup$ I also had the idea to use Monitor[], but what I would have done differently would have been to use MapIndexed[] instead of Do[] (sadly no ScanIndexed[]!), and then slowly change an initial ConstantImage[] of appropriate dimensions pixel-wise with ReplacePixelValue[]. $\endgroup$ Commented Oct 15, 2018 at 20:37

Your Answer

By clicking “Post Your Answer”, you agree to our terms of service and acknowledge you have read our privacy policy.

Not the answer you're looking for? Browse other questions tagged or ask your own question.