15
$\begingroup$

I use the following code to create a histogram of grades. Grades are provided as a List of strings such as "A-", "D+", "E" (don't ask), etc. The +/- substitution hack is necessary to sort the grades in my desired order.

f[s_String] := 
  If[StringLength@s == 1, s <> "b", 
   StringReplace[s, {"+" -> "a", "-" -> "c"}]];
g[s_String] := StringReplace[s, {"a" -> "+", "b" -> "", "c" -> "-"}];
Reverse@Sort@
  Tally@(f /@ {"C", "B-", "B", "B+", "B", "C-", "E", "B", "D", "D+", 
      "C-", "B", "C", "B-", "C+", "E", "B-", "B-", "C-", "A", "C", 
      "B-", "B", "C+", "B", "C", "B+", "C+", "D-", "C", "A", "E", "B",
       "B+", "C", "C", "D+", "D", "C", "C-", "C", "B", "D", "B", "B", 
      "E", "B", "W", "W"})
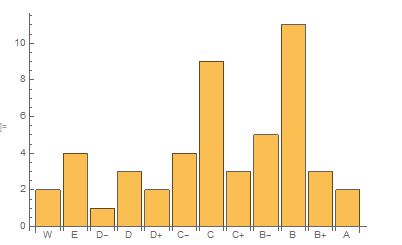
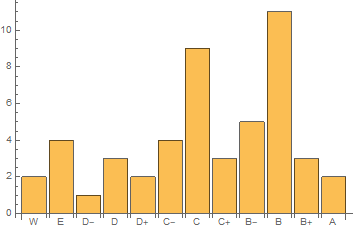
BarChart[Last /@ %, ChartLabels -> g /@ First /@ %]

(* {{"Wb", 2}, {"Eb", 4}, {"Dc", 1}, {"Db", 3}, {"Da", 2}, {"Cc", 
  4}, {"Cb", 9}, {"Ca", 3}, {"Bc", 5}, {"Bb", 11}, {"Ba", 3}, {"Ab", 
  2}} *)

enter image description here

I'm looking for a less hackish way to do this. Any suggestions?

$\endgroup$
2
  • $\begingroup$ ""E" (don't ask)" - that's as effective as saying "don't think of a polka-dotted elephant" ;) Less facetiously: the sorting order is B- < B < B+, correct? $\endgroup$ Commented Sep 28, 2018 at 12:02
  • $\begingroup$ @J.M.issomewhatokay. Yes, you are correct with the sorting order. I was very surprised when moving to my new institution and realized that we don't award "F" grades here... $\endgroup$ Commented Sep 28, 2018 at 13:11

6 Answers 6

22
$\begingroup$

This is a great use for the Association data structure, which makes so many tasks in Mathematica that much more pleasant.

First, we can just write out a ranking of grades:

ranking = {"A+", "A", "A-", "B+", "B", "B-", "C+", "C", "C-", "D+", 
  "D", "D-", "E", "W"};

Then we take your grades and count how many of each there are into an association with Counts:

grades = {"C", "B-", "B", "B+", "B", "C-", "E", "B", "D", "D+", "C-", 
  "B", "C", "B-", "C+", "E", "B-", "B-", "C-", "A", "C", "B-", "B", 
  "C+", "B", "C", "B+", "C+", "D-", "C", "A", "E", "B", "B+", "C", 
  "C", "D+", "D", "C", "C-", "C", "B", "D", "B", "B", "E", "B", "W", 
  "W"};

counts = Counts[grades]
(* <|"C" -> 9, "B-" -> 5, "B" -> 11, "B+" -> 3, "C-" -> 4, "E" -> 4, 
     "D" -> 3, "D+" -> 2, "C+" -> 3, "A" -> 2, "D-" -> 1, "W" -> 2|> *)

This is a table associating each grades with its counts, but it's in a useless order. Let's put it in the order you want, using KeyTake, which we can pass directly to BarChart, which can Automaticly figure out the labels:

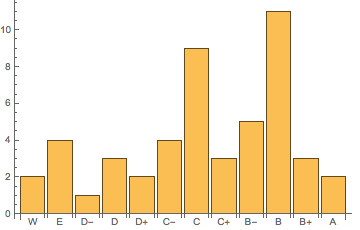
ordered = KeyTake[Counts[grades], Reverse@ranking]
(* <|"W" -> 2, "E" -> 4, "D-" -> 1, "D" -> 3, "D+" -> 2, "C-" -> 4, 
     "C" -> 9, "C+" -> 3, "B-" -> 5, "B" -> 11, "B+" -> 3, "A" -> 2|> *)

BarChart[ordered, ChartLabels -> Automatic]

bar chart

$\endgroup$
4
  • 1
    $\begingroup$ Neat use of Association[]! $\endgroup$ Commented Sep 28, 2018 at 12:32
  • 1
    $\begingroup$ Sorry, I had a stale window that was open for a while, and did not see your answer ... $\endgroup$
    – Szabolcs
    Commented Sep 28, 2018 at 12:42
  • $\begingroup$ @Szabolcs Haha jinx! $\endgroup$
    – Pillsy
    Commented Sep 28, 2018 at 12:47
  • 1
    $\begingroup$ Very nice - I would not have come up with Counts and KeyTake on my own. $\endgroup$ Commented Sep 28, 2018 at 13:13
11
$\begingroup$

I had to deal with similar problems many times, and I usually do this with associations.

We start by defining an exhaustive list of grades in our desired order. I am not that familiar with the American grading system, so I might have gotten some parts of this wrong.

order = {"W", "E-", "E", "E+", "D-", "D", "D+", "C-", "C", "C+", "B-","B", "B+", "A-", "A", "A+"};

We are going to use this to reorder all our datasets. You can produce this list manually or automatically, then re-use it multiple times. In the application that I had, automatic sorting was not possible at all.

Now create the histogram as an association. We try to always work with associations.

hist = Counts[grades]
(* <|"C" -> 9, "B-" -> 5, "B" -> 11, "B+" -> 3, "C-" -> 4, 
 "E" -> 4, "D" -> 3, "D+" -> 2, "C+" -> 3, "A" -> 2, "D-" -> 1, 
 "W" -> 2|> *)

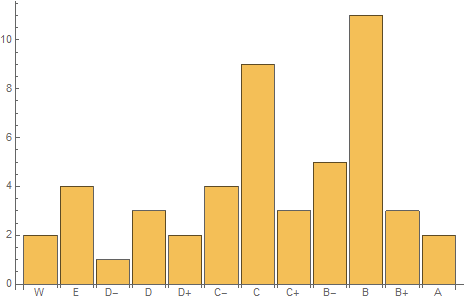
If you only want to keep those grades that actually appear in the dataset, do

BarChart[KeyTake[hist, order], ChartLabels -> Automatic]

Mathematica graphics

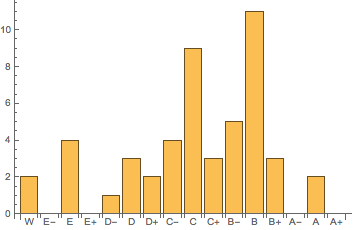
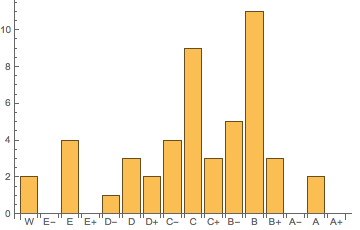
If you also want to keep grades whose count is 0,

BarChart[
 Join[AssociationThread[order, 0], hist],
 ChartLabels -> Automatic
]

Mathematica graphics

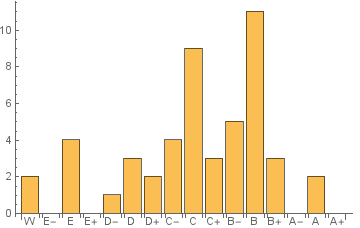
An alternative that is often useful:

BarChart[
 Lookup[hist, order, 0],
 ChartLabels -> order
]

Mathematica graphics

$\endgroup$
1
  • 2
    $\begingroup$ +1 for "Keep grades with counts of zero". (Although we don't award E+ at our institution - that's crazy talk) $\endgroup$ Commented Sep 28, 2018 at 13:15
8
$\begingroup$

Let's write a custom ordering function that Sort[] can use:

gradeOrder[g1_, g2_] := Block[{ord},
     ord = -Order[StringTake[g1, 1], StringTake[g2, 1]];
     If[ord != 0, ord,
        Which[StringLength[g1] == 1, 2 Boole[StringMatchQ[g2, "*+"]] - 1,
              StringLength[g2] == 1, 2 Boole[StringMatchQ[g1, "*-"]] - 1,
              True, Order[StringTake[g1, {2}], StringTake[g2, {2}]]]]]

With this:

grades = {"C", "B-", "B", "B+", "B", "C-", "E", "B", "D", "D+", "C-", "B", "C", "B-",
          "C+", "E", "B-", "B-", "C-", "A", "C", "B-", "B", "C+", "B", "C", "B+", "C+",
          "D-", "C", "A", "E", "B", "B+", "C", "C", "D+", "D", "C", "C-", "C", "B", "D",
          "B", "B", "E", "B", "W", "W"};

Then,

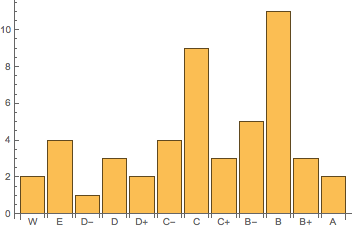
{gl, nl} = Transpose[Tally[Sort[grades, gradeOrder]]];

BarChart[nl, ChartLabels -> gl]

grade chart

$\endgroup$
1
  • $\begingroup$ As I was trying to refactor my code, I was looking in the documentation for examples of more sophisticated ordering functions to pass to Sort. $\endgroup$ Commented Sep 28, 2018 at 13:17
6
$\begingroup$

This question has plenty of answers already, but here's a solution based on the rather useful function PositionIndex. Basically, you first specify the ordering of the grades and then use PositionIndex to construct a ranking function that assigns a number to each grade based on its position in the list:

orderedGrades = {"A+", "A", "A-", "B+", "B", "B-", "C+", "C", "C-", "D+", "D", "D-", "E", "W"};

rankingFunction = With[{
    posIndex = First /@ PositionIndex[orderedGrades]
},
    (* Use 1000 as the default value for any value that doesn't occur in orderedGrades so anything unexpected gets sorted to the end *)
    Lookup[posIndex, #, 1000] &
];

This ranking function can now easily be used in conjunction with SortBy:

grades = {"C", "B-", "B", "B+", "B", "C-", "E", "B", "D", 
   "D+", "C-", "B", "C", "B-", "C+", "E", "B-", "B-", "C-", "A", "C", 
   "B-", "B", "C+", "B", "C", "B+", "C+", "D-", "C", "A", "E", "B", 
   "B+", "C", "C", "D+", "D", "C", "C-", "C", "B", "D", "B", "B", "E",
    "B", "W", "W"};
SortBy[grades, rankingFunction]

{"A", "A", "B+", "B+", "B+", "B", "B", "B", "B", "B", "B", "B", "B", "B", "B", "B", "B-", "B-", "B-", "B-", "B-", "C+", "C+", "C+", "C", "C", "C", "C", "C", "C", "C", "C", "C", "C-", "C-", "C-", "C-", "D+", "D+", "D", "D", "D", "D-", "E", "E", "E", "E", "W", "W"}

$\endgroup$
1
  • $\begingroup$ It's always nice to see different approaches to the problem. $\endgroup$ Commented Oct 26, 2018 at 11:34
5
$\begingroup$
grades = {"C", "B-", "B", "B+", "B", "C-", "E", "B", "D", "D+", 
   "C-", "B", "C", "B-", "C+", "E", "B-", "B-", "C-", "A", "C", "B-", 
   "B",  "C+", "B", "C", "B+", "C+", "D-", "C", "A", "E", "B", "B+", "C", 
    "C", "D+", "D", "C", "C-", "C", "B", "D", "B", "B", "E", "B",  "W",  "W"};
order = {"W", "E-", "E", "E+", "D-", "D", "D+", "C-", "C", "C+", 
   "B-", "B", "B+", "A-", "A", "A+"};

BarChart[Labeled[Count[grades, #], #]& /@ order] 

enter image description here

Alternatively,

BarChart[Count[grades, #] & /@ order, ChartLabels -> order]

same picture

$\endgroup$
4
$\begingroup$

This seems like a simpler approach than other answers, i.e. no separate order list.

grades = {"C", "B-", "B", "B+", "B", "C-", "E", "B", "D", "D+", "C-", "B", "C", 
   "B-", "C+", "E", "B-", "B-", "C-", "A", "C", "B-", "B", "C+", "B", "C", "B+", 
   "C+", "D-", "C", "A", "E", "B", "B+", "C", "C", "D+", "D", "C", "C-", "C", "B", 
   "D", "B", "B", "E", "B", "W", "W"};

f1 = -PadRight[ToCharacterCode@#, 2, 44] &;

BarChart[
  KeySortBy[Counts @ grades, f1]
  , ChartLabels -> Automatic
]

enter image description here

$\endgroup$
2
  • $\begingroup$ +1; however, Mean@ToCharacterCode@"+-" seems less obscure than 44. $\endgroup$
    – Michael E2
    Commented Oct 26, 2018 at 14:31
  • 1
    $\begingroup$ @MichaelE2 My user name entitles me to use magic values. :^) $\endgroup$
    – Mr.Wizard
    Commented Oct 26, 2018 at 14:34

Your Answer

By clicking “Post Your Answer”, you agree to our terms of service and acknowledge you have read our privacy policy.

Not the answer you're looking for? Browse other questions tagged or ask your own question.