2
$\begingroup$

I'm having trouble creating a region with ImplicitRegion. In general, I first limit the region to be within a Parallelogram.

basis = IdentityMatrix[2];
offset = {0, 0};
unitcell = Parallelogram[offset, basis];

I then define a toy function

toy1[x_, y_, n_] := Sort[{Exp[x^2 + y^2], Exp[(x - 1)^2 + (y - 1)^2]}][[n]];

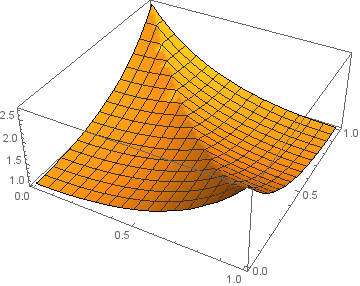
Here's a plot of the first sheet of this toy function

Plot3D[toy1[x, y, 1], {x, y} ∈ unitcell]

The first sheet

I then define a region that is within unitcell and beneath a level set (isocurve) of the toy function

val = 2;
region1 = ImplicitRegion[{x, y} ∈ unitcell && toy1[x, y, 1] < val, {x, y}];
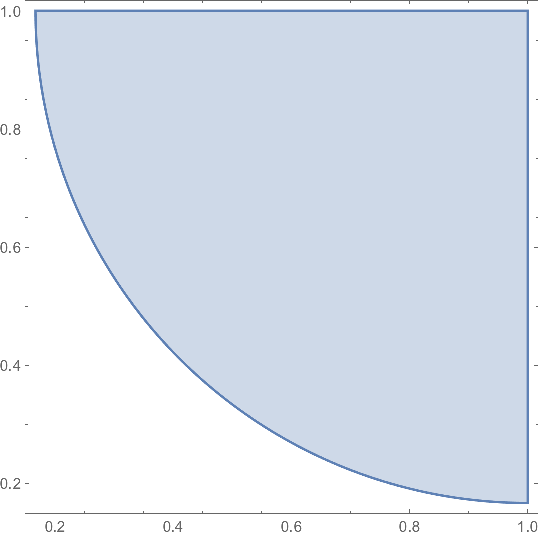
RegionPlot[region1]

region 1

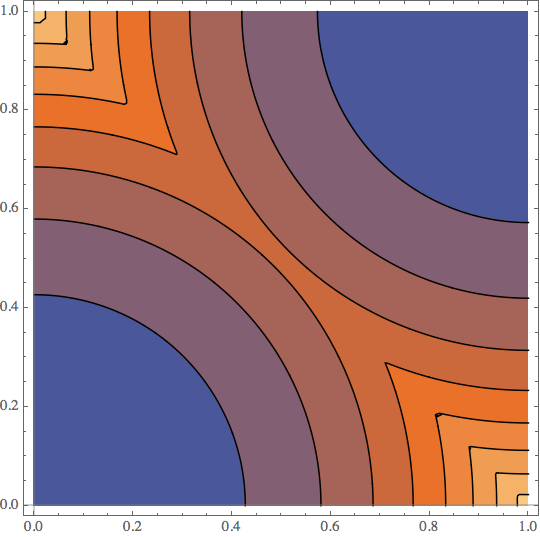
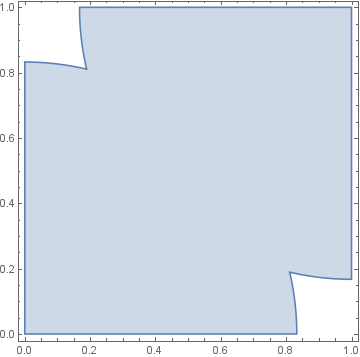
which isn't correct because the contours of the toy function are very different

ContourPlot[toy1[x, y, 1], {x, y} ∈ unitcell]

countour plot 1

It looks like Mathematica isn't sorting the list in toy1. I get what Mathematica gave with another toy function, which is one of the elements in the list of toy1

toy2[x_, y_] := Exp[(x-1)^2 + (y-1)^2];
Plot3D[toy2[x, y], {x, y} ∈ unitcell]
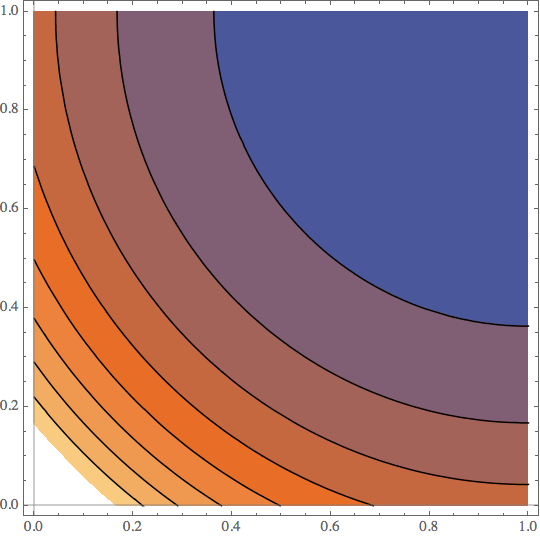
ContourPlot[toy2[x, y], {x, y} ∈ unitcell]
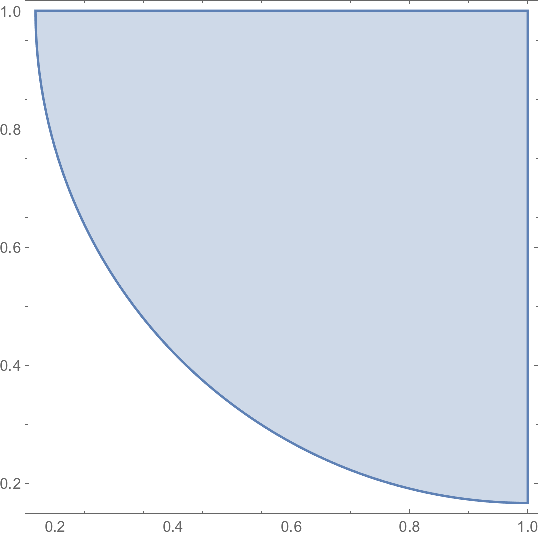
region2 = ImplicitRegion[{x, y} ∈ unitcell && toy2[x, y] <val,{x,y}];
RegionPlot[region2]

toy 2 contour toy 2 region

Is there something I can do to get the correct region that is within a parallelogram (unitcell) and beneath a level set of toy1? I'm running Mathematica 11.3.

$\endgroup$
3
  • $\begingroup$ What are you trying to sort in your function - numbers or symbols? $\endgroup$ Commented Sep 7, 2018 at 8:21
  • $\begingroup$ I'm trying to sort numbers. $\endgroup$
    – jerjorg
    Commented Sep 7, 2018 at 15:41
  • $\begingroup$ Then there is the problem of defining a function toy1. If we calculate it in symbolic form Sort[{Exp[x^2 + y^2], Exp[(x - 1)^2 + (y - 1)^2]}][[1]], then we have E^((-1 + x)^2 + (-1 + y)^2). This branch is used to define ImplicitRegion. If we calculate this function in numerical form, then another branch appears, which is mapped to ContourPlot. $\endgroup$ Commented Sep 8, 2018 at 5:43

2 Answers 2

1
$\begingroup$

An alternative is to use RankedMin instead of Sort:

toy1b[x_, y_, n_] := RankedMin[{Exp[x^2 + y^2], Exp[(x - 1)^2 + (y - 1)^2]}, n]
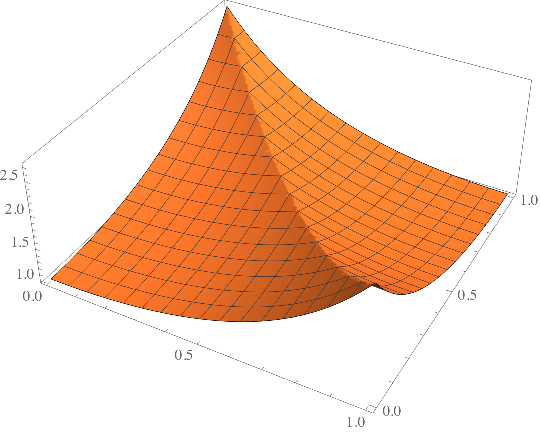
Plot3D[toy1b[x, y, 1], {x, y} ∈ unitcell,  Exclusions-> None]

enter image description here

region1b = ImplicitRegion[{x, y} ∈ unitcell && toy1b[x, y, 1] < val, {x, y}];
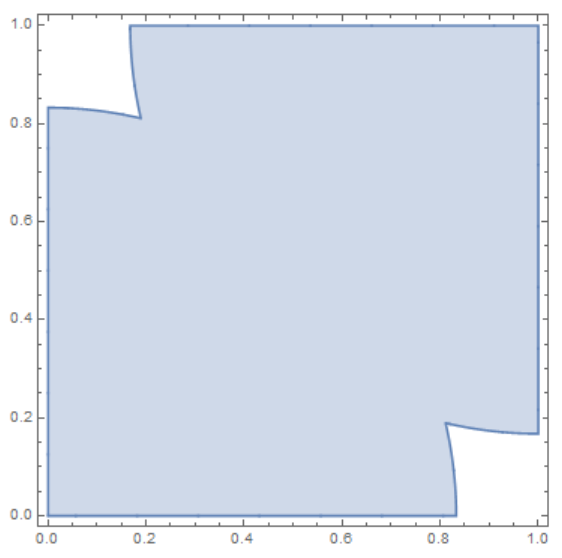
RegionPlot[region1b]  

enter image description here

Yet another alternative is to use {Min, Max}[[n]][...] instead of Sort[...][[n]]:

toy1c[x_, y_,  n_] := {Min, Max}[[n]][{Exp[x^2 + y^2], Exp[(x - 1)^2 + (y - 1)^2]}] 
region1c = ImplicitRegion[{x, y} ∈  unitcell && toy1c[x, y, 1] < val, {x, y}];
RegionPlot[region1c] 

same picture

$\endgroup$
1
$\begingroup$

You can define the function without using Sort.

toy1[x_, y_, n_] := 
 Sort[{Exp[x^2 + y^2], Exp[(x - 1)^2 + (y - 1)^2]}][[n]]

toy2[x_, y_] := 
 If[Exp[x^2 + y^2] < Exp[(x - 1)^2 + (y - 1)^2], Exp[x^2 + y^2], 
  Exp[(x - 1)^2 + (y - 1)^2]]
basis = IdentityMatrix[2];
offset = {0, 0};
unitcell = Parallelogram[offset, basis];
val = 2;
region1 = 
  ImplicitRegion[{x, y} \[Element] unitcell && toy2[x, y] <= val, {x, 
    y}];
RegionPlot[region1]

fig1

$\endgroup$

Your Answer

By clicking “Post Your Answer”, you agree to our terms of service and acknowledge you have read our privacy policy.

Not the answer you're looking for? Browse other questions tagged or ask your own question.