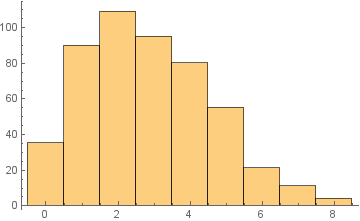
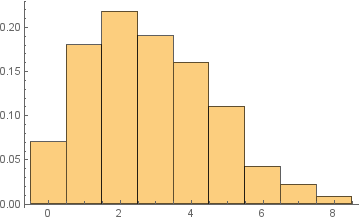
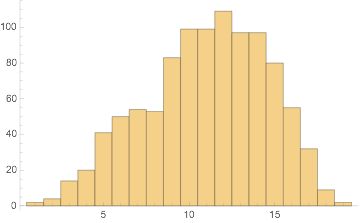
If you are interested in the distribution of $Y$, you don't want a histogram of counts. $Y$ is a discrete random variable. You want the vertical axis to be the estimated probability for the values of $Y$.
A DiscretePlot is what you want. One way to get the appropriate plot is to use HistogramList to get the probabilities.
data = Floor /@ (20 RandomVariate[BetaDistribution[4, 3], 1000]);

probability = HistogramList[data, {Min[data] - 1/2, Max[data] + 1/2, 1}, "PDF"]
(* {{3/2, 5/2, 7/2, 9/2, 11/2, 13/2, 15/2, 17/2, 19/2, 21/2, 23/2, 25/2,
  27/2, 29/2, 31/2, 33/2}, {1/500, 13/500, 21/1000, 51/1000, 29/500,
  23/250, 93/1000, 1/8, 97/1000, 57/500, 19/200, 9/100, 31/500, 57/1000, 17/1000}} *)

DiscretePlot[probability[[2, i - Min[data] + 1]], {i, Min[data], Max[data]}]
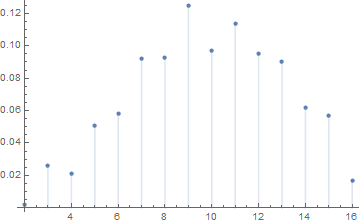
If you really have to have something that looks like a histogram (like if you boss insists on it or you're stuck in the 20th century), then you need to make sure that the bars are centered on the integer values:
Histogram[data, {Min[data] - 1/2, Max[data] + 1/2, 1}, "PDF"]
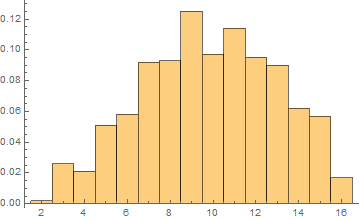
If you don't include {Min[data] - 1/2, Max[data] + 1/2, 1}, then the default will have the bars centered on 0.5, 1.5, 2.5, etc., which are values that $Y$ can't take on.


