3
$\begingroup$

I'm not sure why

SphericalPlot3D[1, {θ, 0, π}, {ϕ, 0, 2 π}, 
 ColorFunction -> 
  Function[{θ, ϕ}, 
   ColorData["Rainbow"][
    Re[SphericalHarmonicY[5, 2, θ, ϕ]]]], 
 ColorFunctionScaling -> False]

looks different to

SphericalPlot3D[1, {θ, 0, π}, {ϕ, 0, 2 π}, 
 ColorFunction -> (ColorData["Rainbow"][
     Re[SphericalHarmonicY[5, 2, #4, #5]]] &), 
 ColorFunctionScaling -> False]

(I don't understand how the # symbols work here.) Which one is correct for plotting this spherical harmonic? But my main question is why do the plots not show the full Rainbow color palette? I would like to plot this spherical harmonic using the full Rainbow color palette from min to max value.

Any help would be greatly appreciated!

UPDATE:

The first question has now been answered. Thank you to all who contributed :-) Here is a simple example to expose my confusion about the color palette (my unanswered question):

SphericalPlot3D[1, {\[Theta], 0, \[Pi]}, {\[Phi], 0, 2 \[Pi]}, 
 ColorFunction -> (ColorData["Rainbow"][
     Re[SphericalHarmonicY[5, 2, #4, #5]]] &), 
 ColorFunctionScaling -> False]
BarLegend[{ColorData[
    "Rainbow"], {MinValue[{ComplexExpand[
       Re[SphericalHarmonicY[5, 
         2, \[Theta], \[Phi]]]], {0 <= \[Theta] < \[Pi], 
       0 <= \[Phi] < 2 \[Pi]}}, {\[Theta], \[Phi]}], 
    MaxValue[{ComplexExpand[
       Re[SphericalHarmonicY[5, 
         2, \[Theta], \[Phi]]]], {0 <= \[Theta] < \[Pi], 
       0 <= \[Phi] < 2 \[Pi]}}, {\[Theta], \[Phi]}] }}, 
  LegendLayout -> "Row"] // Quiet
BarLegend[{"Rainbow", {MinValue[{ComplexExpand[
       Re[SphericalHarmonicY[5, 
         2, \[Theta], \[Phi]]]], {0 <= \[Theta] < \[Pi], 
       0 <= \[Phi] < 2 \[Pi]}}, {\[Theta], \[Phi]}], 
    MaxValue[{ComplexExpand[
       Re[SphericalHarmonicY[5, 
         2, \[Theta], \[Phi]]]], {0 <= \[Theta] < \[Pi], 
       0 <= \[Phi] < 2 \[Pi]}}, {\[Theta], \[Phi]}] }}, 
  LegendLayout -> "Row"] // Quiet

In this example, I suspect that the color function is scaling from 0 to 1 (the first legend), whereas I want the color function to scale from min to max of whatever I'm plotting (the second legend). How do I achieve this?

$\endgroup$
2
  • $\begingroup$ By providing only two arguments you are using the first two slots (x and y) irrespective of what name you call them. Consequently, your first plot is equivalent to SphericalPlot3D[1, {θ, 0, π}, {ϕ, 0, 2 π}, ColorFunction -> (ColorData["Rainbow"][ Re[SphericalHarmonicY[5, 2, #1, #2]]] &), ColorFunctionScaling -> False] $\endgroup$
    – Bob Hanlon
    Commented Jul 25, 2018 at 16:57
  • $\begingroup$ Thank you for your quick reply! This has answered my first question as to why those two lines produce different output, and has also clarified my confusion with the # symbols. Much appreciated :-) $\endgroup$
    – Bart
    Commented Jul 25, 2018 at 18:55

1 Answer 1

1
$\begingroup$

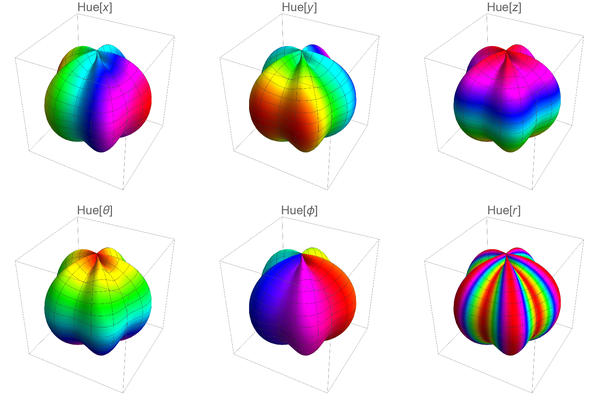
The ColorFunction of a SphericalPlot3D has six arguments, the first three being the $x$, $y$ , $z$ coodinates in $\mathbb{R}^3$. The fourth and fifth argument are the actual parameterization parameters of the surface and the last argument is the distance from the origin (the radius).

# (Slot) and & (Function) together allow to define anonymous function. #4 and #5 refer to the fourth and fifth argument. Here is (essentially) equivalent rewrite with Function in long form:

SphericalPlot3D[1, {θ, 0, π}, {ϕ, 0, 2 π}, 
 ColorFunction -> 
  Function[
   {x, y, z, u, v}, 
   ColorData["Rainbow"][Re[SphericalHarmonicY[5, 2, u, v]]]
   ], 
 ColorFunctionScaling -> False
 ]

Here is the example from the documentation:

GraphicsGrid[
 Partition[#, 3] &@
  Table[SphericalPlot3D[
    1 + Sin[5 ϕ]/10, {θ, 0, Pi}, {ϕ, 0, 2 Pi},
    PlotPoints -> 100,
    ColorFunction -> 
     Function[{x, y, z, θ, ϕ, r}, Evaluate[f]], 
    PlotLabel -> f, 
    Axes -> None], {f, {Hue[x], Hue[y], Hue[z], Hue[θ], 
     Hue[ϕ], Hue[r]}}],

 ImageSize -> Full
 ]

enter image description here

$\endgroup$
9
  • 1
    $\begingroup$ 6 args -- you forgot the radius $\endgroup$ Commented Jul 25, 2018 at 17:55
  • $\begingroup$ @BrettChampion Thanks, good point! I fixed it. $\endgroup$ Commented Jul 25, 2018 at 18:03
  • $\begingroup$ Thank you for your quick reply! This explains really well how the function works and I am understanding the problem a lot better now. Thank you very much :-) I am able to use Hue to get the full color palette (albeit without a BarLegend...), however how do I get my selected color scheme (e.g. Rainbow) to give me the full color palette? I will edit my question with some more examples. Thank you again for your time $\endgroup$
    – Bart
    Commented Jul 25, 2018 at 19:03
  • 2
    $\begingroup$ You have do deactivate the ColorFunctionScaling and to transform yout color function a bit:SphericalPlot3D[1, {\[Theta], 0, Pi}, {\[Phi], 0, 2 Pi}, ColorFunction -> Function[{x, y, z, \[Theta], \[Phi], r}, ColorData["Rainbow"][ Re[SphericalHarmonicY[5, 2, \[Theta], \[Phi]]] + 0.5 ] ], ColorFunctionScaling -> False ] $\endgroup$ Commented Jul 25, 2018 at 20:22
  • 2
    $\begingroup$ No problem, in that case I will just use this: stackoverflow.com/questions/5294955/… $\endgroup$
    – Bart
    Commented Jul 25, 2018 at 20:52

Your Answer

By clicking “Post Your Answer”, you agree to our terms of service and acknowledge you have read our privacy policy.

Not the answer you're looking for? Browse other questions tagged or ask your own question.