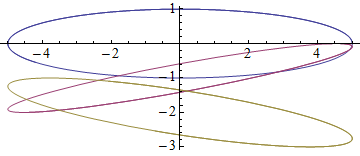
I have written a function f[Ne,t,T], that gives back a list of results when evaluated with numeric values of the variables Ne, t and T.
Now I want to make a ParametricPlot of the first element of the resulting list against another function g[t,T] for different values of the parameter T. So I try it for example like this:
TList={0,1,2};
ParametricPlot[ Table[ {Part[f[5,t,T],1] , g[t,T]} , {T,TList}] ,{t,0,10}]
Since I didn't use Evaluate inside ParametricPlot, all the curves have the same color. But if I do us Evaluate inside ParametricPlot, for example like this:
TList={0,1,2};
ParametricPlot[ Evaluate@Table[ {Part[f[5,t,T],1] , g[t,T]} , {T,TList}] ,{t,0,10}]
then Part is acting too early, and f[5,t,T] is evaluated to 5 (which is of course the first part of the expression f[5,t,T]), but that's clearly not that what I want. I want the Table command to be evaluated, so that ParametricPlot can "see" the different curves, but I want the first part of f[Ne,t,T] to be taken after the function f[5,t,T] is evaluated for the actual value of t. So what can I do?


fandg? $\endgroup$f[Ne_?NumericQ,t_?NumericQ,T_?NumericQ]:={Ne t T,0}andg[t_,T_]:=t Sin[T]testing my solution. $\endgroup$