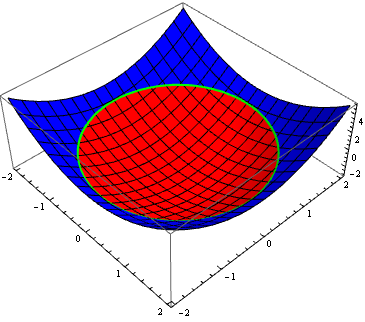
You probably want
Plot3D[f[x, y], {x, -2, 2}, {y, -2, 2}, MeshFunctions -> {#3 &},
 Mesh -> {{0}}, MeshStyle -> {Directive[Thick, Green]},
 MeshShading -> {Red, Blue}, PlotRange -> All]
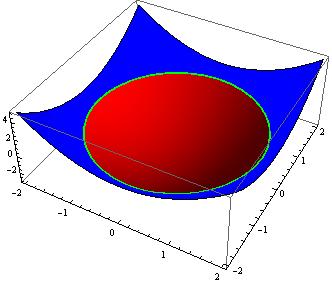
Alternatively,
Plot3D[Evaluate[ConditionalExpression[f[x, y], #] & /@ {f[x, y] <= 0,
    f[x, y] > 0}], {x, -2, 2}, {y, -2, 2}, PlotStyle -> {Red, Blue},
 Mesh -> None, BoundaryStyle -> {1 -> Directive[Thick, Green], 2 -> None}]
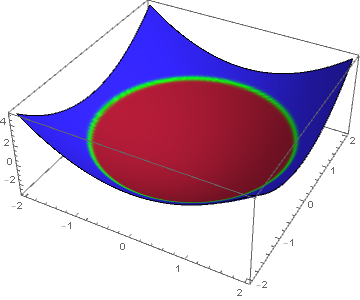
Compare with what you get with ColorFunction (note the absence of Green line and the blending of Red and Blue at the boundary):
Plot3D[f[x, y], {x, -2, 2}, {y, -2, 2}, ColorFunction -> MyColorFunc,
 PlotRange -> All, ColorFunctionScaling -> False]
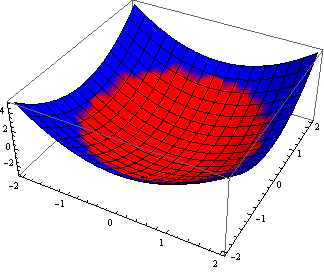
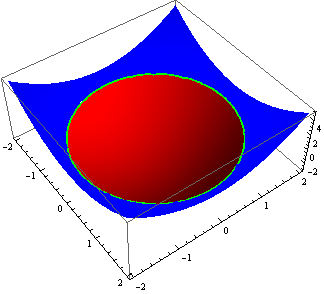
Update: We can eliminate the blending using Exclusions -> {f[x,y] == 0} and use the option ExclusionsStyle to color the boundary between the two pieces:
Plot3D[f[x, y], {x, -2, 2}, {y, -2, 2},
 Exclusions -> {f[x, y] == 0},
 ExclusionsStyle -> Directive[Thick, Green],
 ColorFunction -> MyColorFunc, PlotRange -> All,
 ColorFunctionScaling -> False]
