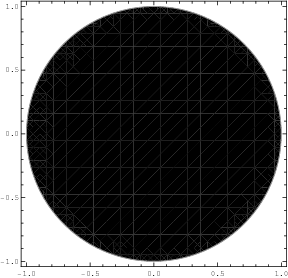
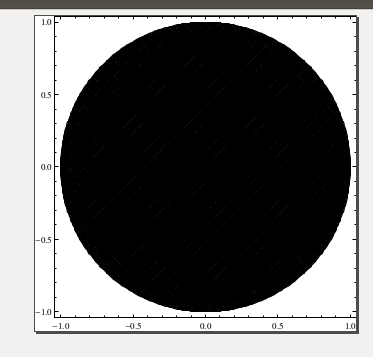
The suggestion to use Antialiasing->False doesn't really solve the problem. I don't have a single solution that's appropriate in all cases, but I think one of the approaches I list on the following web page will work:
Avoiding artifacts in shaded contour and density plots
Edit:
The following method from the linked article solves the problem:
Instead of exporting the image (assumed to be stored in im1), export the modified graphics
im1 /. {EdgeForm[], r_?(MemberQ[{RGBColor, Hue, CMYKColor, GrayLevel}, Head[#]] &), i___} :> {EdgeForm[r], r, i}
This replaces the invisible edges of the polygons (EdgeForm[]) in your graphic (called im1 here) by edges of default thickness and with a color matching at least one of the neighboring polygons. The new edges then help fill any empty space between the shaded areas.
Edit 2
My solution relies on finding colored polygons without colored edges by looking for EdgeForm[] followed by a color in the graphic im1.
Based on the answer by Mr. Wizard and kguler here, one can also make the above work better with custom colors and future additions to the built-in color choices:
colorQ = FreeQ[Quiet@Darker@#, Darker] &;
im1 /. {EdgeForm[], r_?colorQ, i___} :> {EdgeForm[r], r, i}
Edit 3
Thanks to @becko for pointing out that there is a new command ColorQ in version 10 that can do the same as above. So you can replace colorQ in the previous edit with ColorQ.


ListContourPlot, not justRegionPlot$\endgroup$