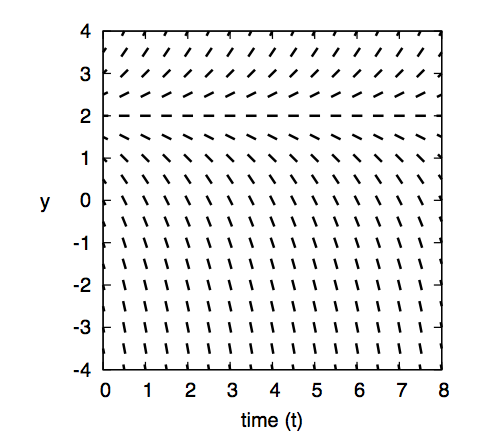
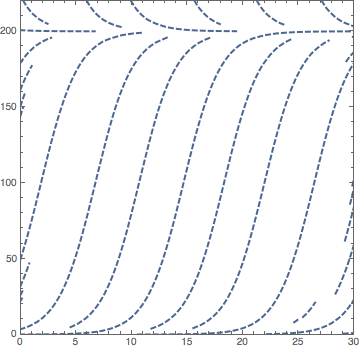
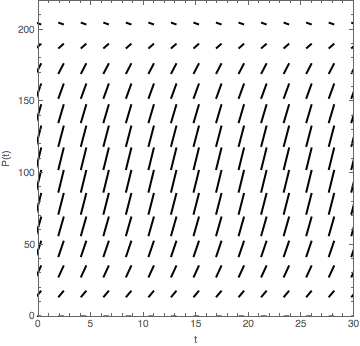
I would like to create a plot in Mathematica similar to
for the equation $\frac{d P}{dt}=P(0.6-0.003P).$
My attempt so far is
StreamPlot[{1, P (0.6 - 0.003 P)}, {t, 0, 30}, {P, 0, 220},
 PlotRangePadding -> Automatic, StreamPoints -> {Automatic, 0.1},
 StreamScale -> None, StreamStyle -> {Thick, Dashed},
 ImageSize -> Medium, PlotRange -> {{0, 30}, {0, 220}}, Axes -> True,
 AxesLabel -> {"t", "P(t)"}]
My questions are
- Why don't the Axes labels appear on the image?
- How can I increase the density of the stream points?
- Can I increase the thickness of the lines?
- How can I change the colour of the lines to black?
- Some stream points appear and disappear how can I get rid of these odd looking points?


StreamStyle -> {Thickness[0.01], Black, Dashed}; andFrameLabelinstead ofAxesLabel. $\endgroup$