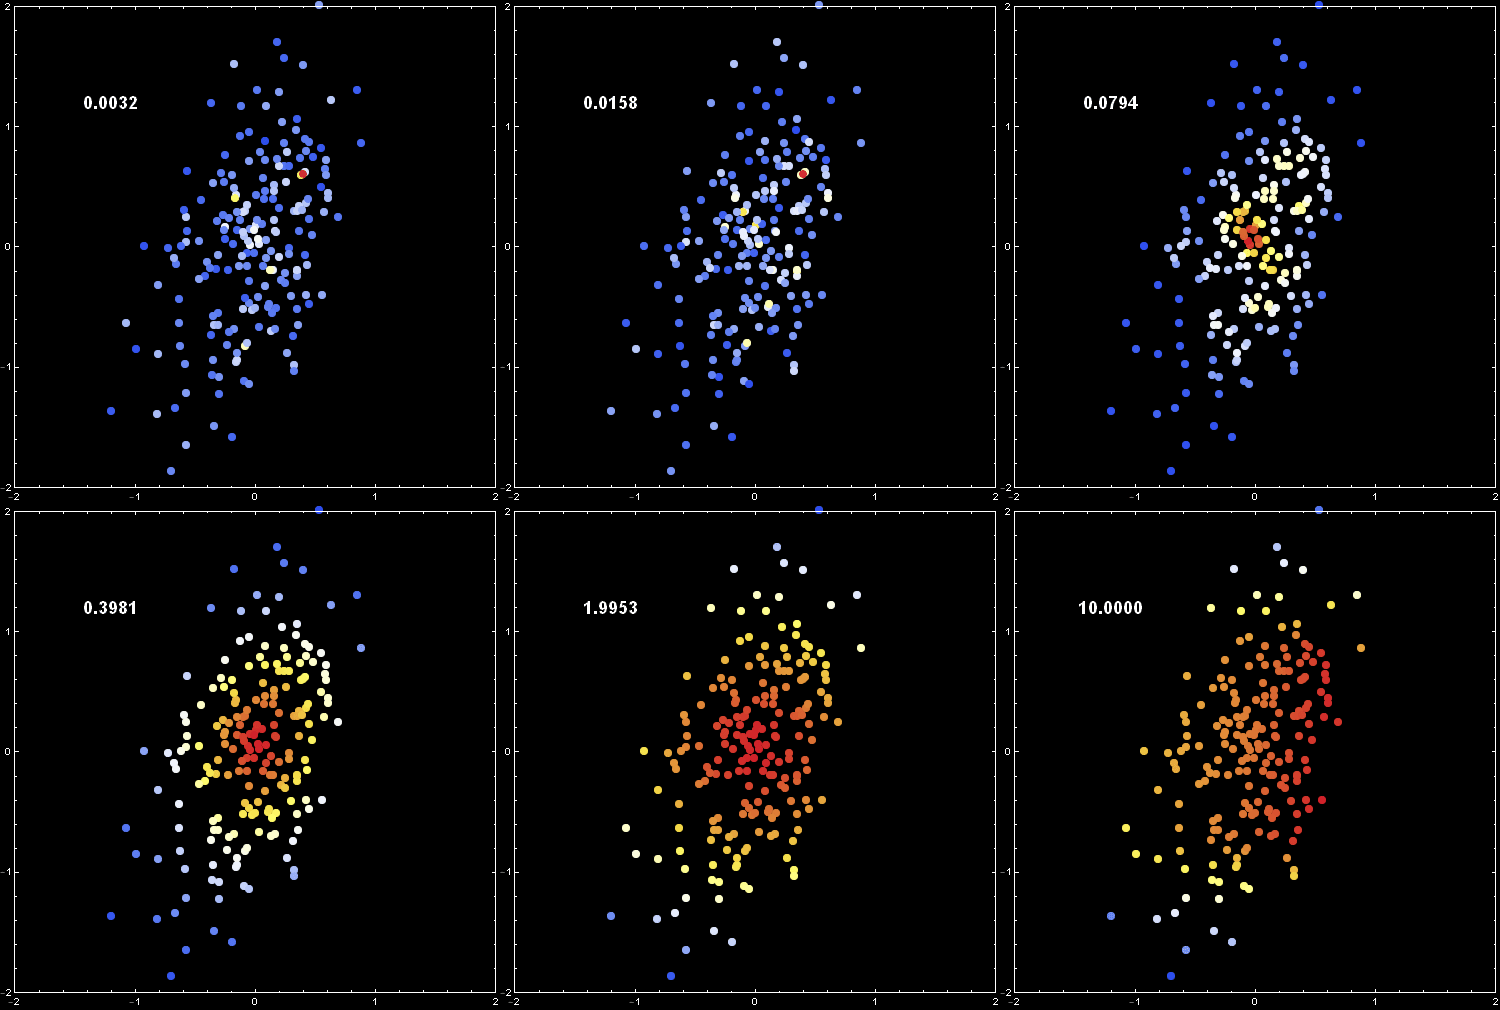
I have the position of some points in the 2D plane. How can I plot points in the 2D plane, with different colors so that, each color shows the local density of points? I need denser points to be in different color comparing with lower dencity points
$\begingroup$
$\endgroup$
4
-
1$\begingroup$ This: 6081 or that: 27786? $\endgroup$– KubaCommented Nov 10, 2017 at 7:54
-
$\begingroup$ Is there a way to show a unit vector in the position of each particle? @Kuba $\endgroup$– Oliver RangeCommented Nov 10, 2017 at 8:40
-
$\begingroup$ Yes they are. thank you for the links/ $\endgroup$– Oliver RangeCommented Nov 10, 2017 at 8:41
-
$\begingroup$ How can I show larger points?@Kuba $\endgroup$– Oliver RangeCommented Nov 10, 2017 at 8:43
Add a comment
|
1 Answer
$\begingroup$
$\endgroup$
1
If not those links then probably this:
data = RandomVariate[BinormalDistribution[.75], 50];

d = SmoothKernelDistribution[data];


colors = Rescale[#, MinMax[#], {0, 1}] & @ PDF[d, data];

Graphics[
 {AbsolutePointSize@12,
  Point[data, VertexColors -> (Blend["TemperatureMap", #] & /@ colors)]
  }
 ]
You can play with bandwidth:
data = RandomVariate[BinormalDistribution[{0, 0}, {.4, .7}, .5], 200];

Animate[
  d = SmoothKernelDistribution[data, 10.^bw]
; colors = Blend["TemperatureMap", #
  ] & /@ Rescale[#, MinMax[#], {0, 1}] & @ PDF[d, data]

; Graphics[{
      Inset[Style[NumberForm[10.^bw, {∞, 2}], Bold, 18], Scaled[{.2, .8}]]
    , AbsolutePointSize@12, Point[data, VertexColors -> colors]
    }
  , Frame -> True
  , PlotRange -> 2
  , ImageSize -> 500
  , Background -> Black
  , FrameStyle -> White
  ]
, {bw, -2, 1, .2}
]
-
$\begingroup$ Let us continue this discussion in chat. $\endgroup$– KubaCommented Nov 10, 2017 at 9:51

