0
$\begingroup$

I need to extract the data from plots created inside the module environment to re draw my plots in a better plotter that Mathematica.

I have a code that includes several matrix multiplications, and works with data that i introduce every time i need to run the function created in the module environment. So, i already have this graphs thanks to the Print option, but i can't extract the coordinates from this plots inside that environment with the answers given in the forums.

Code:

grafi[inf_,sup_,tem_] := Module[{x, m1, m2, matri, elem22, co},
  m1[x_] = ( {{x, 100},{10, tem}} );
  m2[x_] = ( {{200, 1},{tem, x}} );
  matri[x_] = m2[x].m1[x].m2[x];

  elem22[x_] := matri[x][[2, 2]] ;
  co[x_] := 1/Abs[elem22[x]]^2;

  Print[Plot[co[x], {x, inf, sup}]]

  ]

If later I call the function grafi like this:

grafi[10,10000,50]

I obtain the plot i want. But i can't extract the data from here. Help! Thanks.

$\endgroup$
5
  • 5
    $\begingroup$ Please provide a minimal example to work with and describe what exactly do you need at the end. What about 94481? $\endgroup$
    – Kuba
    Commented Sep 8, 2017 at 9:14
  • 1
    $\begingroup$ How about not just printing them, but placing them explicitly in the output? e.g. Module[{vars}, calculations; Print[plots]; {originaloutput, plot1, plot2, plot3}]? Then manipulate the output as you please. $\endgroup$
    – LLlAMnYP
    Commented Sep 8, 2017 at 11:37
  • $\begingroup$ Hey @LLlAMnYP, i think i had that idea in the past but i couldn't get the data for some reason. Would you be more specific so i can try it again in this way? Thanks. $\endgroup$
    – Ah77
    Commented Sep 9, 2017 at 19:41
  • $\begingroup$ Use . instead of * to multiply matrices; see this. Also, remove the Print[] as it does not make the plot easily usable by other functions. Thus: grafi[inf_, sup_, opts___] := Plot[1/Abs[({{200, 1}, {x, x}}.{{x, 100}, {10, 50}}.{{200, 1}, {x, x}})[[2, 2]]]^2 // Evaluate, {x, inf, sup}, opts]; grafi[10, 1*^4] $\endgroup$ Commented Sep 9, 2017 at 22:27
  • $\begingroup$ "I can't extract the coordinates from this plot" - again, the Print[] is the problem there; remove it so that you can do something like Cases[plot, Line[l_] :> l, ∞]. $\endgroup$ Commented Sep 11, 2017 at 8:16

1 Answer 1

1
$\begingroup$

You can simplify your function a bit since Print is not needed:

grafi[inf_, sup_, tem_] := 
 Module[{x, m1, m2, matri, elem22, co}, 
  m1[x_] = ({{x, 100}, {10, tem}});
  m2[x_] = ({{200, 1}, {tem, x}});
  matri[x_] = m2[x].m1[x].m2[x];
  elem22[x_] := matri[x][[2, 2]];
  co[x_] := 1/Abs[elem22[x]]^2;
  Plot[co[x], {x, inf, sup}]]

and then this

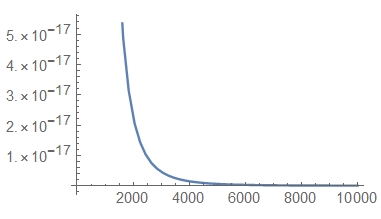
pl = grafi[10, 10000, 50]

gives you a plot

enter image description here

Now the list of points to be plotted have the tree coordinates {1, 1, 1, 3, 1, 2, 1}. Thus, this

lst = pl[[1, 1, 1, 3, 1, 2, 1]]

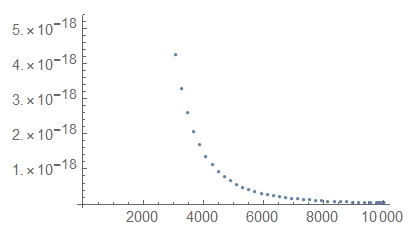
gives you the desired list of points. Let us check it:

PlotList[lst]

enter image description here

Done, have fun!

$\endgroup$

Your Answer

By clicking “Post Your Answer”, you agree to our terms of service and acknowledge you have read our privacy policy.

Not the answer you're looking for? Browse other questions tagged or ask your own question.