I have two functions $f(x,y),g(x,y)$. $x$, $y$, $f$ and $g$ are all real (in fact, $y$ is strictly positive and $x$ and $f$ are nonnegative). $f$ and $g$ are complicated enough not to be invertible (i.e. I can't obtain analytical expressions for $x(f,g),y(f,g)$), so I have tabulated the values of $x$ and $y$ for different values of $f$ and $g$ (which took forever). I now wish to obtain $x$ and $y$ for given values of $f$ and $g$. I want this to be quick (because I'll be doing this for huge lists of $(f,g)$ pairs), so I'd like to use the tables rather than something like NSolve (which I used to build the tables). Is there a way to interpolate the table values in order to do this efficiently?
I don't think I explained myself very well, so I'll give a very simple example. Say I have the following:
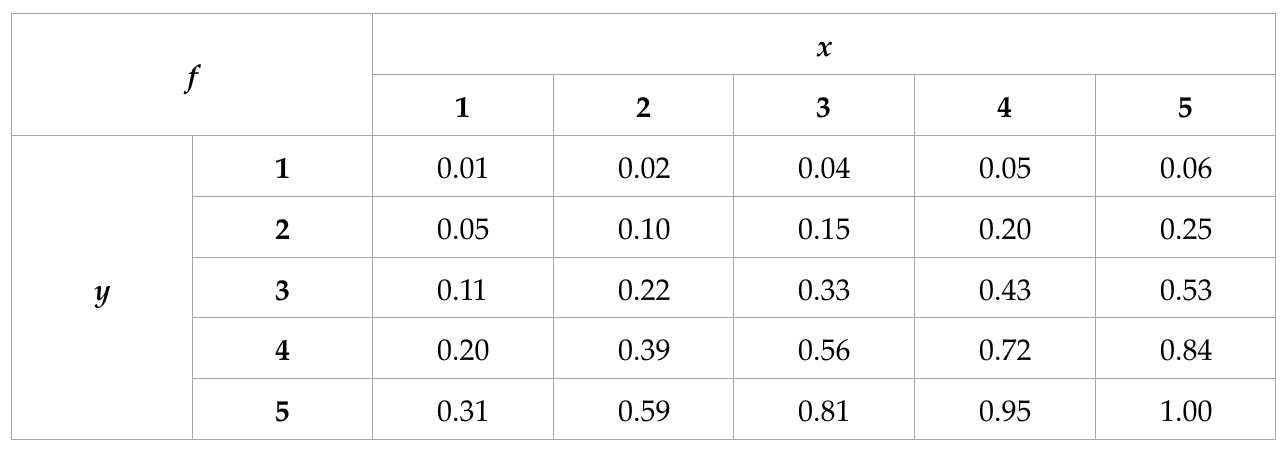
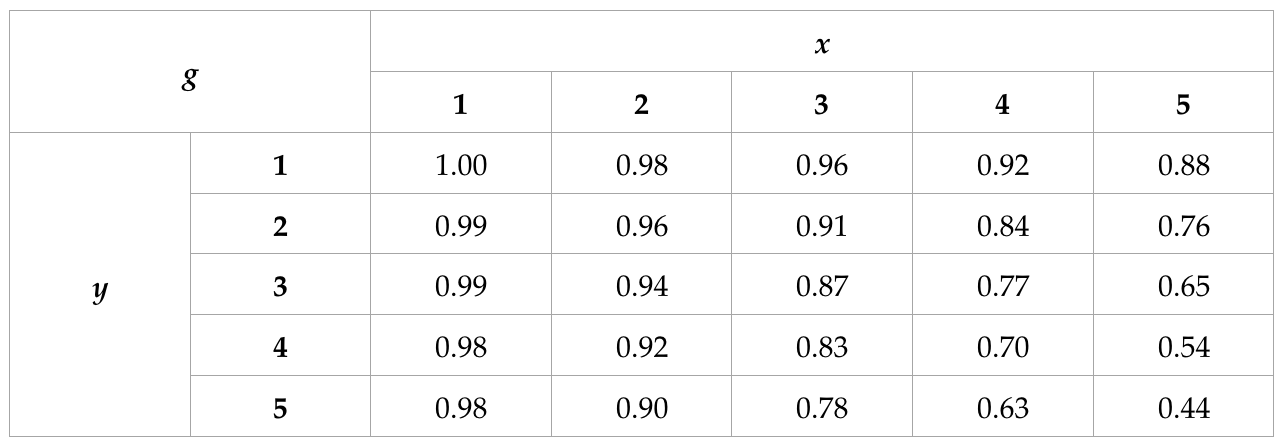
Copyable version:
f={{0.01, 0.02, 0.04, 0.05, 0.06}, {0.05, 0.1, 0.15, 0.2, 0.25}, {0.11, 0.22, 0.33, 0.43, 0.53}, {0.2, 0.39, 0.56, 0.72, 0.84}, {0.31, 0.59, 0.81, 0.95, 1.}}
g={{1., 0.98, 0.96, 0.92, 0.88}, {0.99, 0.96, 0.91, 0.84, 0.76}, {0.99, 0.94, 0.87, 0.77, 0.65}, {0.98, 0.92, 0.83, 0.7, 0.54}, {0.98, 0.9, 0.78, 0.63, 0.44}}
Then I read $f=0.27,g=0.85$. I go to my tables and figure out where $x$ and $y$ could lie:
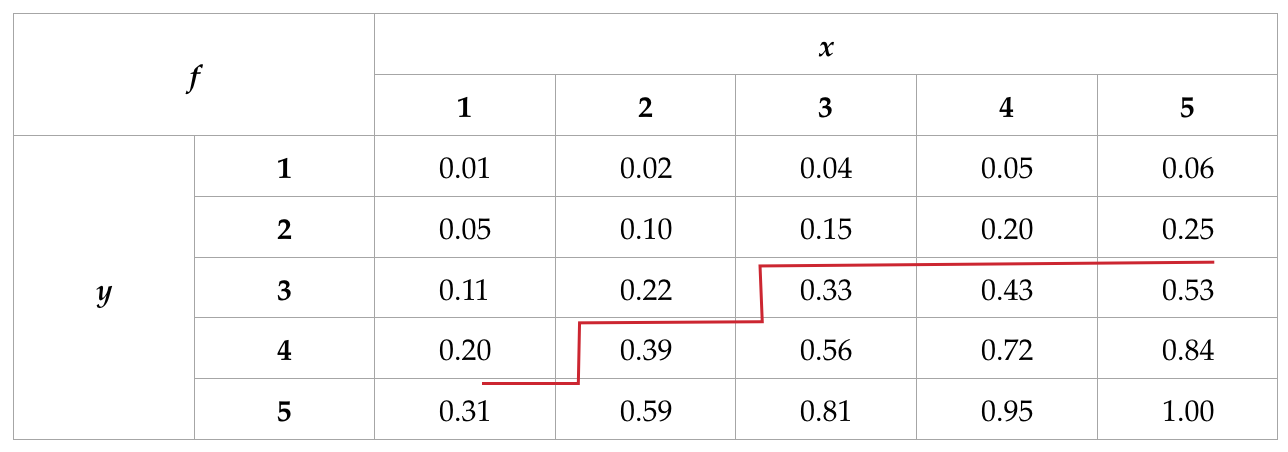
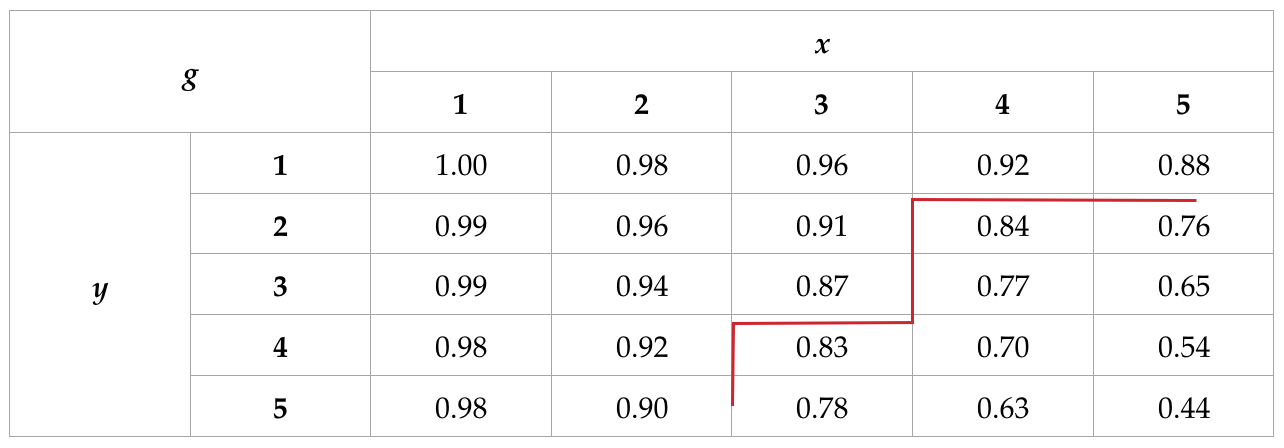 (i.e. given the value of $f$, we could have $x=1$ and $4<y<5$, $1<x<y$ and $3<y<5$, etc; a similar analysis is undertaken for $g$). I then put the $f$ and $g$ analyses together and come up with the following:
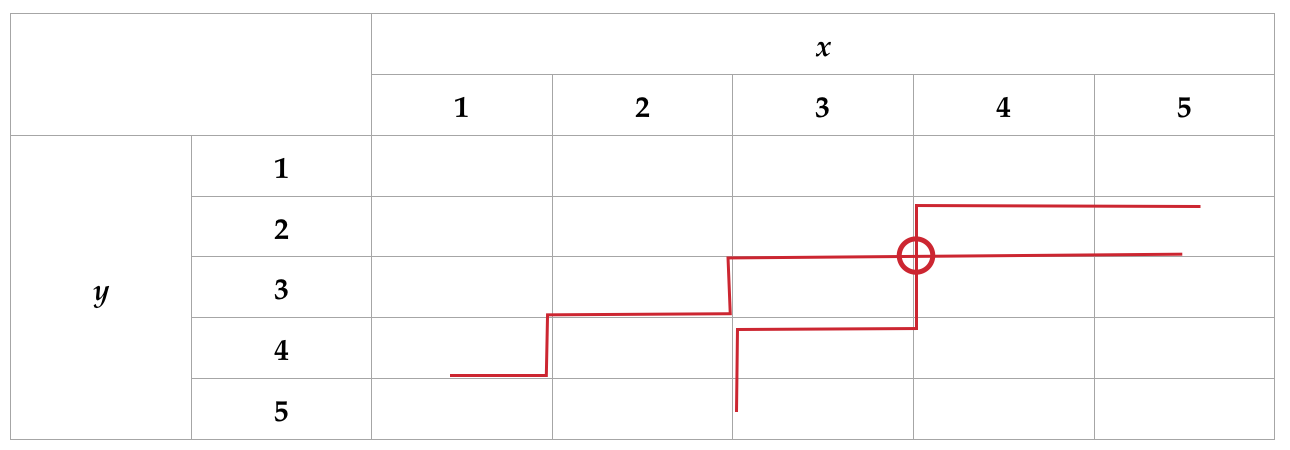 $x=3.5\pm0.5,y=2.5\pm0.5$ (the uncertainties are due to my resolution; I imagine there are better ways to calculate a reasonable uncertainty for this situation, but that's beyond the point).
Of course, interpolation is more complicated than that, but I just wanted to show what sort of thing I'm trying to do.
I looked at the documentation of ListInterpolation, but that simply interpolates between elements of a list and I have no idea how to combine that with something that goes through two tables and figures out where $x$ and $y$ should lie. I suppose I could write a code that reads values for $f$ and $g$, goes through each cell in the $f$ table, figures out where $x$ and $y$ could be by comparing the cell's value with the neighbouring cells' values and the value of $f$ I've given it, does the same for $g$ and returns the intersection of the two subsets of $\text{dom}(x)\times\text{dom}(y)$ obtained from the tables, but
- I wouldn't know how to deal with multiple possibilities (e.g. if $x=3.5,y=2.5$ and $x=4,y=1.5$ are both possible, how do I tell which combination of $x$ and $y$ is better?)
and
- this seems awfully slow and inefficient.
I found this, but that question seems to be about fitting a function to data, while I already know that my functions ($x$ and $y$) have no analytical expressions, and what I'm trying to do is obtain the values of two functions from the tables given single values of the variables ($f$ and $g$) rather than obtaining a function for any value of the variables (which is what the OP of that question was trying to do).
Thanks in advance for any help.

fdata={{0.01,0.02,0.04,0.05,0.06},{0.05,0.10,0.15,0.20,0.25},{0.11,0.22,0.33,0.43,0.53},{0.20,0.39,0.56,0.72,0.84},{0.31,0.59,0.81,0.95,1.00}}; gdata={{1.00,0.98,0.96,0.92,0.88},{0.99,0.96,0.91,0.84,0.76},{0.99,0.94,0.87,0.77,0.65},{0.98,0.92,0.83,0.70,0.54},{0.98,0.90,0.78,0.63,0.44}};$\endgroup$fandg? There are probably better ways to invert such functions than your approach. $\endgroup$