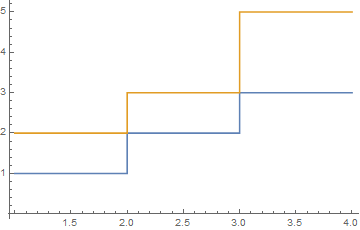
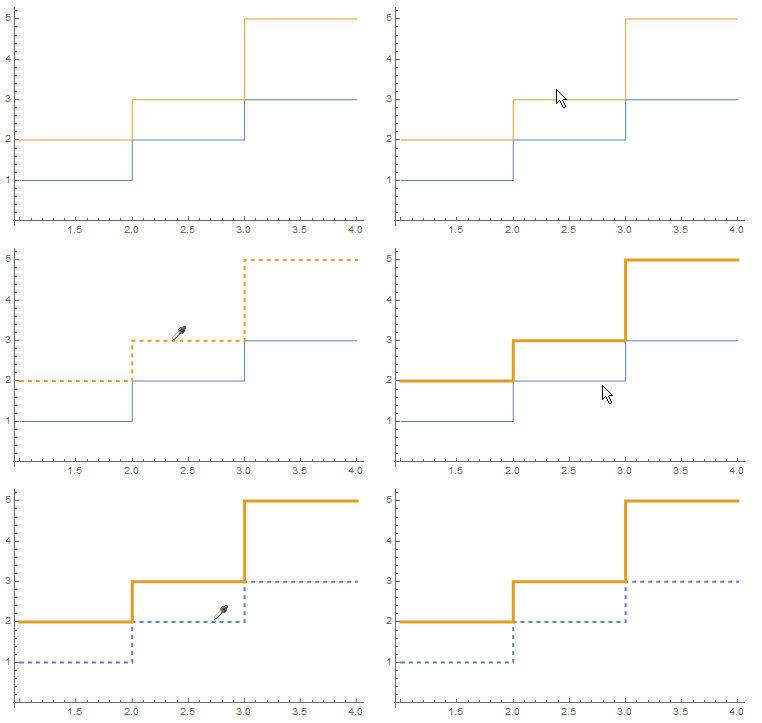
I have a plots with many lines and would like to be able to highlight lines when clicked (or on mouseover). When the data plotted is small this works well
styles = {Automatic, Automatic};
Dynamic@ListStepPlot[
  MapIndexed[
    EventHandler[#,
      {"MouseClicked" :>
        (styles[[#2[[1]]]] =
           styles[[#2[[1]]]] /. {Thick -> Automatic, Automatic -> Thick})}] &,
    {{1, 2, 3}, {2, 3, 5}}],
  PlotStyle -> styles]

But my data is large and including the complete ListStepPlot inside Dynamic makes it very slow.
So I tried this, but it didn't work:
styles = {Automatic, Automatic};
ListStepPlot[
  MapIndexed[
    EventHandler[#,
      {"MouseClicked" :>
        (styles[[#2[[1]]]] =
           styles[[#2[[1]]]] /. {Thick -> Automatic, Automatic -> Thick})}] &,
    {{1, 2, 3}, {2, 3, 5}}],
  PlotStyle -> Dynamic[styles]]
I know that Dynamic can be used for some Plot options values but apparently not for PlotStyle. Is there a way to make this work efficiently for large data sets?


ListStepPlot[{{1, 2, 3}, {2, 3, 5}}, BaseStyle -> Thick] /. {styles__, l_Line} :> {styles, MouseAppearance[Dynamic@Mouseover[{Thin, l}, {Thick, l}], "LinkHand"]}? $\endgroup$