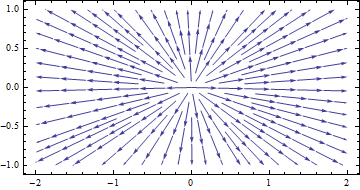
I have a scalar function given by
f[x_,y_]:=x^2+y^2
I want to plot the streamlines of a vector field given by the gradient of f, $\nabla f$. I thought the easiest way to do that was to call
StreamPlot[{D[f[x, y], x], D[f[x, y], y]}, {x, -2, 2}, {y, -1, 1},
  AspectRatio -> Automatic]
But it throws errors saying that some numbers are not valid variables. I also tried to use numerical differentiation.
Needs["NumericalCalculus`"]
StreamPlot[{ND[f[x, y], x], ND[f[x, y], y]}, {x, -2, 2}, {y, -1,
  1}, AspectRatio -> Automatic]
That gives an empty plot. Calling the Grad method also gives an empty plot.
StreamPlot[Grad[foo[x, y], {x, y}], {x, -2, 2}, {y, -1, 1},
  AspectRatio -> Automatic]
I found the following code, taken from here which does what I want, but it seems to be too much work. Is there a simple way to plot the stream lines of the gradient of scalar function?
listGradientFieldPlot[grid_?((Length[Dimensions[#]] == 2) &),
  opts : OptionsPattern[]] :=
 Module[{img, cont, densityOptions, contourOptions, frameOptions,
   plotRangeRule, delX, delY, gridSpacing, gradField, gradNorm, field,
    fieldL, rangeCoords, maxNorm,
   paddedGrid = ArrayPad[grid, 1, "Extrapolated"]},
  gridSpacing = (DataRange /. {opts}).{-1, 1};
  If[! NumericQ[Norm[gridSpacing]], gridSpacing = {1, 1},
   gridSpacing = gridSpacing/Reverse[Dimensions[grid] - 1]];
  densityOptions =
   Join[FilterRules[{opts},
     FilterRules[Options[ListDensityPlot],
      Except[{Prolog, Epilog, FrameTicks, PlotLabel, ImagePadding,
        GridLines, Mesh, AspectRatio, PlotLabel, PlotRangePadding,
        Frame, Axes}]]], {PlotRangePadding -> None, Frame -> None,
     Axes -> None, AspectRatio -> Automatic}];
  contourOptions =
   Join[FilterRules[{opts},
     FilterRules[Options[ListContourPlot],
      Except[{Prolog, Epilog, FrameTicks, PlotLabel, Background,
        ContourShading, Frame, Axes}]]], {Frame -> None, Axes -> None,
      ContourShading -> False}];
  delX = (RotateRight[paddedGrid, {0, 1}] -
       RotateLeft[paddedGrid, {0, 1}])[[2 ;; -2, 2 ;; -2]]/
    gridSpacing[[1]];
  delY = (RotateRight[paddedGrid] - RotateLeft[paddedGrid])[[2 ;; -2,
     2 ;; -2]]/gridSpacing[[2]];
  gradNorm = Sqrt[delX*delX + delY*delY];
  gradField =
   MapThread[{#2, #1} &, {Transpose[delY], Transpose[delX]}, 2];
  maxNorm = Max[Abs[gradNorm]];
  gradField = Chop[gradField/maxNorm];
  fieldL =
   ListDensityPlot[gradNorm, Evaluate@Apply[Sequence, densityOptions]];
  field = First@Cases[{fieldL}, Graphics[__], \[Infinity]];
  plotRangeRule = FilterRules[Quiet@AbsoluteOptions[field], PlotRange];
  rangeCoords = Transpose[PlotRange /. plotRangeRule];
  img = Rasterize[field, "Image"];
  cont = If[
    MemberQ[{0,
      None}, (Contours /. FilterRules[{opts}, Contours])], {},
    ListContourPlot[grid, Evaluate@Apply[Sequence, contourOptions]]];
  frameOptions =
   Join[FilterRules[{opts},
     FilterRules[Options[Graphics],
      Except[{PlotRangeClipping, PlotRange}]]], {plotRangeRule,
     Frame -> True, PlotRangeClipping -> True,
     PlotLabel -> Row[{"Maximum field =", maxNorm}]}];
  If[Head[fieldL] === Legended, Legended[#, fieldL[[2]]], #] &@
   Apply[Show[
      Graphics[{Inset[
         Show[SetAlphaChannel[img,
           "ShadingOpacity" /. {opts} /. {"ShadingOpacity" -> 1}],
          AspectRatio -> Full], rangeCoords[[1]], {0, 0},
         rangeCoords[[2]] - rangeCoords[[1]]]}], cont,
      ListStreamPlot[gradField,
       Evaluate@FilterRules[{opts}, StreamStyle],
       Evaluate@FilterRules[{opts}, StreamColorFunction],
       Evaluate@FilterRules[{opts}, DataRange],
       Evaluate@FilterRules[{opts}, StreamColorFunctionScaling],
       Evaluate@FilterRules[{opts}, StreamPoints],
       Evaluate@FilterRules[{opts}, StreamScale]], ##] &,
    frameOptions]]
And the expected plotting:
grid = Transpose@Table[y^2 + x^2, {x, -2, 2, .1}, {y, -1, 1, .1}];
l1 = listGradientFieldPlot[grid, ColorFunction -> "BlueGreenYellow",
  Contours -> 10, ContourStyle -> White, Frame -> True,
  FrameLabel -> {"x", "y"}, InterpolationOrder -> 2,
  ClippingStyle -> Automatic, Axes -> True, StreamStyle -> Orange,
  ImageSize -> 500, DataRange -> {{-1.57, 3.43}, {-1.57, 1.43}}]

