-1
$\begingroup$

Let's consider the following simple example

Clear["Global`*"];
C0 = ContourPlot3D[x^2 + y^2 + z^2 == 1, {x, -1, 1}, {y, -1, 1}, {z, -1, 1}, 
Mesh -> None, PlotPoints -> 100, PerformanceGoal -> "Speed"];
S0 = Show[{C0}, AxesStyle -> Directive[FontSize -> 20, FontFamily -> "Helvetica"], 
AxesLabel -> {"x", "y", "z"}, BoxStyle -> Directive[Black, Thickness[0.005]], 
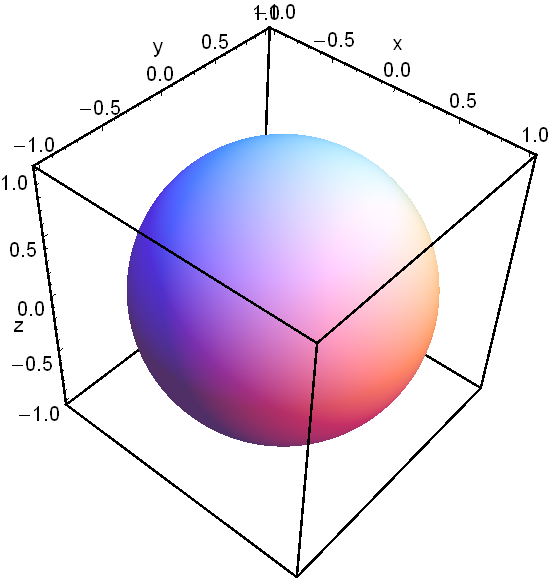
PlotRange -> All, BoxRatios -> {1, 1, 1}, ImageSize -> 550]

enter image description here

Now I want the following: remove all ticks (and numbers) from all three axes, while keeping the labels $x$, $y$, and $z$. If it was a simple 2D plot I could use FrameTicks -> None.

Any ideas?

$\endgroup$
1

2 Answers 2

3
$\begingroup$

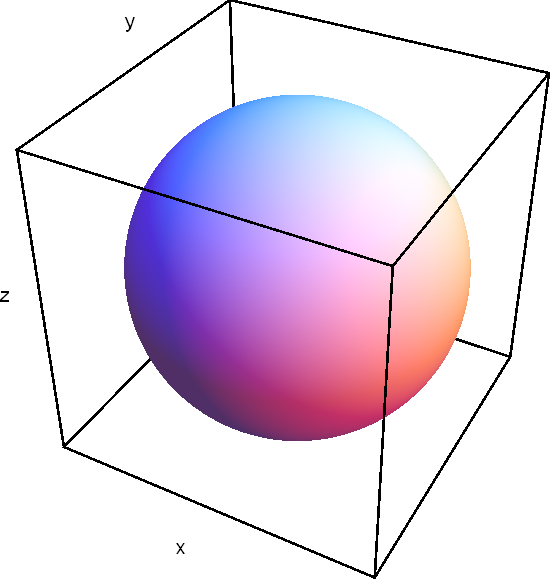
I just found that Ticks -> None simply does what I want!

enter image description here

$\endgroup$
0
2
$\begingroup$

Adopting @Royce suggestion over here,

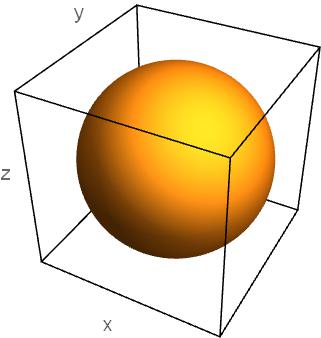
Ticks -> {Table[{2 i, 2 i, 0}, {i, 7}], None}

enter image description here

$\endgroup$
2
  • $\begingroup$ I used this trick in v9 but the ticks on the vertical axis remain unperturbed! $\endgroup$
    – Vaggelis_Z
    Commented Apr 30, 2017 at 14:53
  • $\begingroup$ @Vaggelis_Z I cannot confirm that coz I am using v11. $\endgroup$
    – zhk
    Commented Apr 30, 2017 at 15:06

Not the answer you're looking for? Browse other questions tagged or ask your own question.