1
$\begingroup$

I am trying to add some cursors to a plot. I am using LocatorPane and form the cursors by setting the Appearance option. However, I can't seem to find out how big the cursors will be and I need them to rescale according to the data I am using.

Here is a minimum working example. First some data.

 data1 = Table[{f, 1/Sqrt[(100^2 - f^2)^2 + 0.1 f^2]}, {f, 0, 300, 
        0.1}];
 data2 = Table[{f, (Sqrt[0.1] 100)/
        Sqrt[(100^2 - f^2)^2 + 0.1 f^2]}, {f, 0, 300, 0.1}];

Here is a dynamic module which plots the data and provides the cursors.

ClearAll[curPlot];
curPlot[] := DynamicModule[{pt1 = {10, 0.02}, pt2 = {200, 0.02}},
  LocatorPane[
   Dynamic[{pt1, 
     pt2}, (pt1 = {#[[1, 1]], 0.02}; pt2 = {#[[2, 1]], 0.02}) &],
   Dynamic@
    ListPlot[data, Joined -> True, PlotRange -> All, Frame -> True, 
     Axes -> False, ImageSize -> 6 72],
   Appearance -> 
    Graphics[{Red, Line[{{0, 0}, {0, 1}}]}, 
     ImageSize -> {Automatic, 3 72 /GoldenRatio}]
   ]
  ]

If I set

data = data1;

and then

curPlot[]

I get
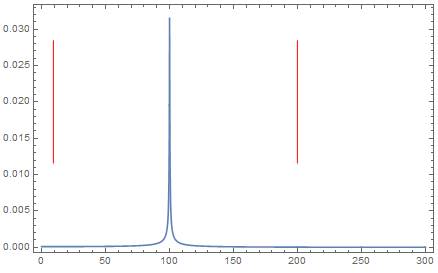
Mathematica graphics

If I now change to the other data by setting

data = data2;

The plot changes to
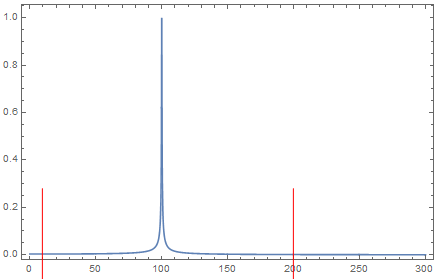
Mathematica graphics

I want the plot to change dynamically like this when data is changed.

How do I make the cursor length occupy the whole height of the plot? I have been trying to see if it is involved with the ImageSize but can't work it out at the moment.

I actually need a more advanced version with a log plot. The code is now

ClearAll[curPlot2];
curPlot2[] := DynamicModule[{pt1 = {10, 0.02}, pt2 = {200, 0.02}},
  LocatorPane[
   Dynamic[{pt1, 
     pt2}, (pt1 = {#[[1, 1]], 0.02}; pt2 = {#[[2, 1]], 0.02}) &],
   Dynamic@
    ListLogPlot[data, Joined -> True, PlotRange -> All, 
     ImageSize -> 6 72, Frame -> True],
   Appearance -> 
    Graphics[{Red, Line[{{0, 0}, {0, 1}}]}, 
     ImageSize -> {Automatic, 3 72/GoldenRatio }]
   ]
  ]

With data = data1; I get nothing but with data = data2; I get:
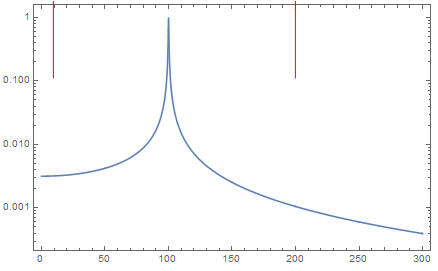
Mathematica graphics

I really need to understand how the locator is formed and positioned. Thanks for any help.

$\endgroup$
2
  • $\begingroup$ to be clear, you want the red lines to go from the lower end to the upper end of the plot? $\endgroup$
    – glS
    Commented Mar 17, 2017 at 13:44
  • $\begingroup$ Exactly. Vertical lines from the bottom of the plot to the top. I have just thought that this may be difficult due to image padding. The lines may cross the axes into the labeled tick marks. I am not going to be too fussy if that happens. The first thing is to get them onto the plot. $\endgroup$
    – Hugh
    Commented Mar 17, 2017 at 14:52

1 Answer 1

3
$\begingroup$

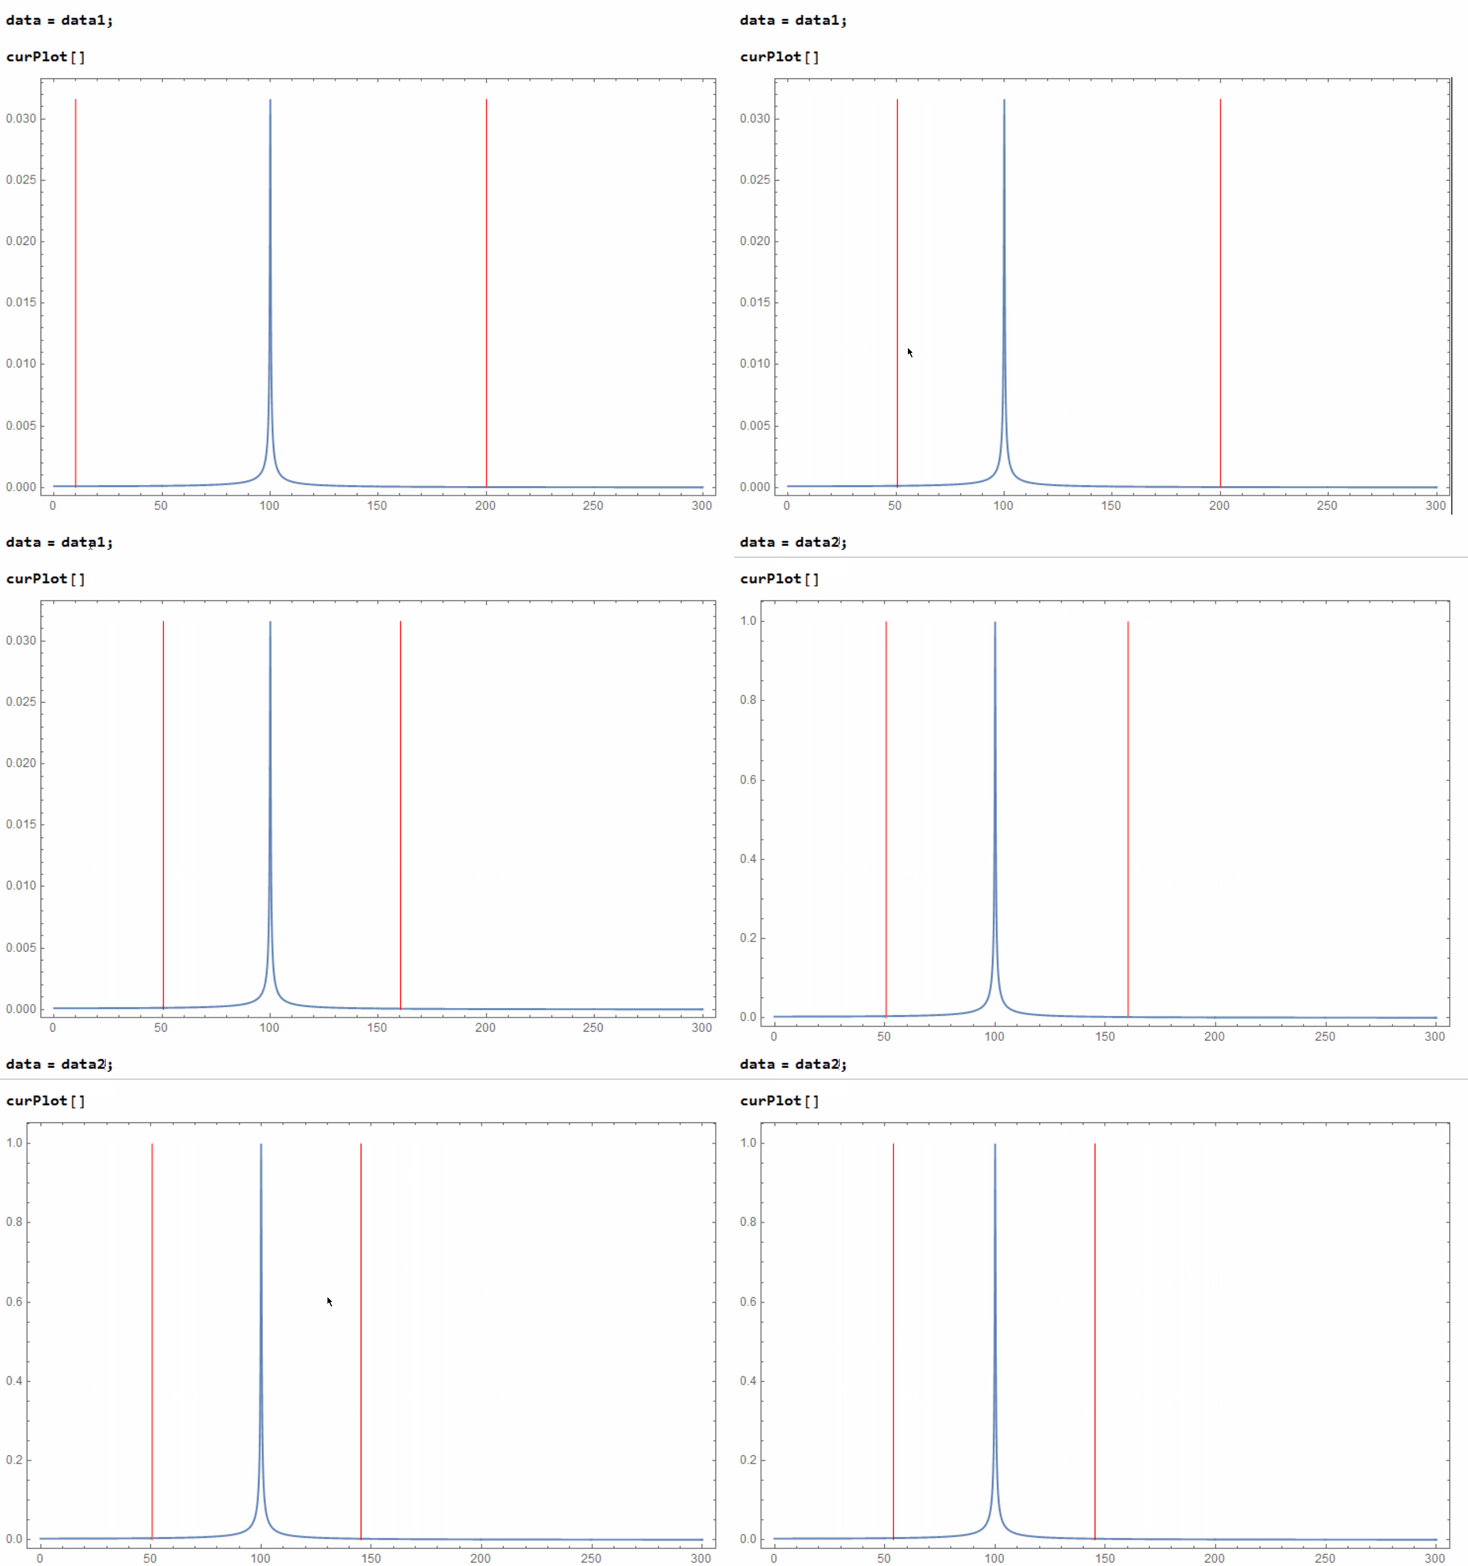
EDIT: Preserving the interface with LocatorPane

The problem with this is to manage to have the Graphics object given to the Appearance argument exactly of the same shape as the image generated by the ListPlot. This includes, at least, same ImageSize and same AspectRatio.

I still didn't manage to have the lines exactly span the whole image, so if someone can pitch in and suggest what other graphics options I overlooked that would be great.

getYRangeFromPlot[plot_] := 
  AbsoluteOptions[plot, PlotRange][[1, 2, 2]];
getAspectRatioFromPlot[plot_] := Options[plot, AspectRatio][[1, 2]];

ClearAll[curPlot];
curPlot[] := DynamicModule[{pt1 = {10, 0}, pt2 = {200, 0.}, plot},
  LocatorPane[
   Dynamic[{pt1, pt2},
    (pt1 = {#[[1, 1]], Mean@getYRangeFromPlot@plot}; 
      pt2 = {#[[2, 1]], Mean@getYRangeFromPlot@plot}) &
    ],
   Dynamic[
    plot = ListPlot[data,
      Joined -> True, PlotRange -> All, Frame -> True,
      Axes -> False, ImageSize -> 400, PlotRangePadding -> None,
      ImageMargins -> 0
      ];
    pt1[[2]] = pt2[[2]] = Mean@getYRangeFromPlot@plot;
    plot
    ],
   Appearance -> Graphics[
     {Red, Line@{{0, -1}, {0, 1}}},
     ImageSize -> Dynamic@CurrentValue[plot, ImageSize],
     PlotRange -> All,
     AspectRatio -> Dynamic@getAspectRatioFromPlot@plot,
     PlotRangePadding -> None
     ]
   ]
  ]

Reimplementing the feature with EventHandler

All right, this is much more involved than I wanted it to be, but at the end I found it easier to just reimplement the functionality using EventHandler primitives:

data1 = Table[{f, 1/Sqrt[(100^2 - f^2)^2 + 0.1 f^2]}, {f, 0, 300, 
    0.1}];
data2 = Table[{f, (Sqrt[0.1] 100)/
     Sqrt[(100^2 - f^2)^2 + 0.1 f^2]}, {f, 0, 300, 0.1}];

closerPoint[xCoordinates_List] := MapIndexed[
      {First@#2, Abs[MousePosition["Graphics"][[1]] - #1]} &,
      xCoordinates
      ] // SortBy[#[[2]] &] // First // First;

ClearAll@curPlot;
curPlot[] := DynamicModule[
  {
   x1, x2, xToMove,
   plotRange, plot
   },
  plotRange[] := AbsoluteOptions[plot, PlotRange][[1, 2, 2]];
  x1 = 10;
  x2 = 200;
  EventHandler[
   Function[graphics, Dynamic[graphics, TrackedSymbols :> {data}], 
     HoldAll]@Show[
     plot = ListPlot[data,
       Joined -> True,
       PlotRange -> All,
       Frame -> True,
       Axes -> False, ImageSize -> Medium,
       PlotRangePadding -> None
       ],
     Graphics[{Red,
       Line@{{Dynamic@x1, First@plotRange[]}, {Dynamic@x1, 
          Last@plotRange[]}},
       Line@{{Dynamic@x2, First@plotRange[]}, {Dynamic@x2, 
          Last@plotRange[]}}
       }]
     ],
   {
    "MouseDown" :> 
     Set[xToMove, {Hold@x1, Hold@x2}[[closerPoint@{x1, x2}]]],
    "MouseDragged" :> (xToMove /. 
       Hold[s_] :> Set[s, MousePosition["Graphics"][[1]]])
    }
   ]
  ]

enter image description here

You can adjust the not perfect filling of the red lines by simply setting PlotRangePadding -> None.

$\endgroup$
1
  • $\begingroup$ Thanks for the speedy answer. This is a whole different approach. I will look to see if I can work this in my full problem as opposed to my minimum working example. $\endgroup$
    – Hugh
    Commented Mar 17, 2017 at 16:20

Your Answer

By clicking “Post Your Answer”, you agree to our terms of service and acknowledge you have read our privacy policy.

Not the answer you're looking for? Browse other questions tagged or ask your own question.