2
$\begingroup$

Below I give the definition of custom ticks

ticksHelper[min_, max_] := 
 Module[{out = 
Charting`ScaledTicks[{Identity, Identity}][min, max] // #[[;; , {1, 2}]] & // Cases[#, {_, _?NumberQ}] &}, 
If[First@Last@out < max, AppendTo[out, {max, "> " <> ToString@max}],
out[[-1, -1]] = "> " <> ToString@max];
out]

and this is a simple example

min = 0;
max = 5;
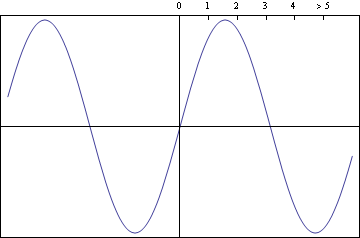
Plot[Sin[x], {x, -6, 6}, Frame -> True, FrameTicks -> {{None, None}, {None, ticksHelper[min, max]}}]

enter image description here

We see that 6 ticks are printed, which is fine.

Now if we change to range to

min = 0;
max = 3;
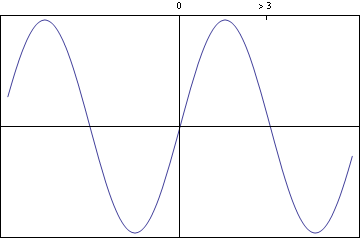
Plot[Sin[x], {x, -6, 6}, Frame -> True, FrameTicks -> {{None, None}, {None, ticksHelper[min, max]}}]

enter image description here

only two ticks are printed.

In my case, min is always 0, while max can always be divided by 5 (i.e., min equals to 0.5, 3, 5, etc).

I want always six labels to be printed inside the given range. For example, if max equals to 0.5 I want the ticks (0, 0.1, 0.2, 0.3, 0.4, 0.5), while if max equals to 2.5 I want the ticks (0, 0.5, 1.0, 1.5, 2.0, 2.5).

Any suggestions?

Many thanks in advance!

$\endgroup$
4
  • $\begingroup$ See FindDivisions. The charting function is good if you don't know in advance a decent way to subdivide your range. $\endgroup$
    – LLlAMnYP
    Commented Mar 9, 2017 at 15:50
  • $\begingroup$ @LLlAMnYP I did not developed these custom ticks, so I really don;t know what changes should be done in the module. Any specific suggestions would be great! $\endgroup$
    – Vaggelis_Z
    Commented Mar 9, 2017 at 15:53
  • $\begingroup$ I'm on mobile so I can't be more specific right now, but I suggest comparing the output of the Charting`ScaledTicks[...][...] vs. FindDivisions[{min, max}, 6] $\endgroup$
    – LLlAMnYP
    Commented Mar 9, 2017 at 15:57
  • $\begingroup$ @LLlAMnYP It does not seem to work. $\endgroup$
    – Vaggelis_Z
    Commented Mar 9, 2017 at 16:27

2 Answers 2

3
$\begingroup$

I'll expand on my comment.

charting[min_, max_] := Charting`ScaledTicks[{Identity, Identity}][min, max]
  // #[[;; , {1, 2}]] & // Cases[#, {_, _?NumberQ}] &

is in some respects equivalent to

finddivs[min_, max_] := FindDivisions[{min, max}, 6]

For example

charting[1.1, 5.9]
finddivs[1.1, 5.9]
charting[0.9, 6.1]
finddivs[0.9, 6.1]

returns:

{{2., 2}, {3., 3}, {4., 4}, {5., 5}}
{1, 2, 3, 4, 5, 6}
{{1., 1}, {2., 2}, {3., 3}, {4., 4}, {5., 5}, {6., 6}}
{0, 1, 2, 3, 4, 5, 6, 7}

Neither of them is exact; Mathematica does not find intervals like {0., 0.6, 1.2, 2.4, 3.0} to be "nice".

Given your specification (numbers divisible by 5, starting from 0), the easiest is to do:

sixTicks[max_] := Transpose[{#, #}] &[Range[0., max, max/5]

and to modify ticksHelper like so:

ticksHelper[min_, max_] := 
  Module[{out = sixTicks[max]}, 
out[[-1, -1]] = "> " <> ToString@max;
out]

Update 10.03.17

At first I suggested an undocumented, internal function

Charting`ScaledTicks

to generate the necessary ticks semi-automatically and then to post-process the output to get the more detailed specifications required by the OP. Usually -- when working internally -- this function takes the plot range and generates a nice set of ticks for that range. E.g.,

(Charting`ScaledTicks[{Identity, Identity}][-0.132, 1.145]
    // #[[;; , ;; 2]] &               (* strips tick style specs *)
  // DeleteCases[#, {_, _Spacer}] &)  (* removes minor ticks *)
{{0.,0},{0.25,0.25},{0.5,0.50},{0.75,0.75},{1.,1.00}}

This leaves us with a very simple list of {position, label} tuples. Note, how I fed the function an awkward range like (-0.132, 1.145) but it tried to return a list of sufficiently round numbers. By the way, it also formatted each number to have two digits after the decimal. Peeking at the FullForm we can see that the 0.50 (list element [[3,2]]) is actually

NumberForm[0.5, {DirectedInfinity[1], 2}]

As I have mentioned, FindDivisions[{min, max}, n] does a similar thing, subdividing a given range into approximately n intervals.

This is of somewhat limited use for the OP, since these automatic functions -- among other things -- may or may not indeed include a tick at max.

When fine control is desired, there are packages for this, such CustomTicks and/or for such a specific use case it may be easier to simply roll a quick function. Hopefully, this update will describe in enough detail, how to do it, rather than just do it.

As mentioned before, OP has

min = 0;
max = ...;

where max (or perhaps, rather, 10 * max) is divisible by 5. To properly describe the procedure, I'll verbosely rewrite the helper functions sixTicks and ticksHelper.

First we need the positions of the ticks, which I immediately generate to machine precision; these are quite simply {0, max/5, 2max/5, ...} or

positions = Range[0., max, max/5];

Next, we need the labels at these positions. I, generally, prefer casting them to strings, like so:

labels = ToString /@ positions

and then the ticks will be

Transpose[{positions, labels}]

There's two things to handle: OP wants the last tick label to be > max, which is trivially done by

labels[[-1]] = "> " <> labels[[-1]]

OP also wants the numbers to have equal number of digits after the decimal point, which is slightly harder. In fact, a very quick search couldn't find an easy way to ask Mathematica

Ok, we have a machine-precision number like 0.0032. Sure, the precision of it is 15.84 or so, but how many digits are there really, for us humans?

and to get the obvious answer 4. Well, one quick and dirty approach is to multiply by 10, compare the result to Floor[result], if not, multiply by 10 again, and so on.

Length[NestWhileList[10 # &, 0.25, Floor@# != # &]] - 1
Length[NestWhileList[10 # &, 0.0032, Floor@# != # &]] - 1
(* 2 *)
(* 4 *)

We know for sure, that the longest decimal representation of our list of numbers will be no longer than the representation of max/5. So let's start putting all this together in a Module

ticks[max_] := Module[
  {
    positions = Range[0., max, max / 5],
    precision = Length[NestWhileList[10 # &, max / 5, Floor@# != # &]] - 1,
    labels},
  If[precision > 0, 
    labels = ToString /@ (NumberForm[#, {Infinity, precision}] & /@ positions)];
  If[precision == 0,
    labels = ToString /@ Floor[positions]];
  labels[[-1]] = "> " <> labels[[-1]];
  Transpose[{positions, labels}]
]

Most things here I've covered. To get the correct formatting of numbers, I've borrowed the function used in the output of Charting`ScaledTicks, i.e. NumberForm. NumberForm[0.016, {Infinity, 4}] will print 0.016 with 4 digits to the right of the decimal, i.e. 0.0160. The two If statements handle the special case that all labels are integers, so Floor turns machine-preicsion numbers like 1. into integers like 1. For integers NumberForm is unnecessary.

Plot[Sin[200 x], {x, -0.02, 0.02},
  Frame -> True, FrameTicks -> {{None, None}, {None, ticks[0.016]}}]

enter image description here

I hope, this answer doesn't give the fish, but also the fishing rod.

$\endgroup$
10
  • $\begingroup$ It works however there is a minor issue. For example when max = 10 the ticks are 0. 2. 4. 6. 8. > 10, while I would like to be 0 2 4 6 8 > 10. This is doable if I set [Range[0, max, max/5]. On the other hand when max = 4 it prints 0 0.8 1.6 2.4 etc. I want the following: when there are no decimal digits to print the numbers without the dots (2 instead of 2.), while when there are decimal digits to print the zero with the same number of decimal digits (i.e., 0.0 instead of 0.). Is this possible? $\endgroup$
    – Vaggelis_Z
    Commented Mar 9, 2017 at 20:09
  • $\begingroup$ @vag This is certainly possible with a pattern - matching construct, i.e. look for reals/rationals. It's mildly out of scope, but if no one answers this, I'll expand the answer tomorrow. (I'm on mobile again) $\endgroup$
    – LLlAMnYP
    Commented Mar 9, 2017 at 20:31
  • $\begingroup$ Take your time and update your answer if possible. It would be very nice to have ticks with equal number of decimal digits, just for consistency! $\endgroup$
    – Vaggelis_Z
    Commented Mar 9, 2017 at 20:34
  • $\begingroup$ @Vaggelis I see this is your second question over a couple of days about ticks. I think, it would be best if I add a separate, somewhat more general answer about ticks and specifications, etc. $\endgroup$
    – LLlAMnYP
    Commented Mar 10, 2017 at 13:27
  • $\begingroup$ That would be very nice. It would be also useful if the suggested solution is compatible with earlier versions of Mathematica (i.e., v9.0). $\endgroup$
    – Vaggelis_Z
    Commented Mar 10, 2017 at 13:29
3
$\begingroup$

At least starting from version 10 Charting`ScaledTicks[{Identity, Identity}] accepts second argument which allows to specify the number of major and minor ticks in the range. For example, 7 or {7, 1} as the second argument switches off generation of minor ticks and requests about 7 "nice" numbers that divide the interval into equally spaced parts:

Charting`ScaledTicks[{Identity, Identity}][##, {7, 1}] &[0, .5]
{{0., 0, {0.01, 0.}, {AbsoluteThickness[0.1]}}, 
 {0.1, 0.1, {0.01, 0.}, {AbsoluteThickness[0.1]}}, 
 {0.2, NumberForm[0.2, {Infinity, 1}], {0.01, 0.}, {AbsoluteThickness[0.1]}}, 
 {0.3, NumberForm[0.3, {Infinity, 1}], {0.01, 0.}, {AbsoluteThickness[0.1]}}, 
 {0.4, NumberForm[0.4, {Infinity, 1}], {0.01, 0.}, {AbsoluteThickness[0.1]}}, 
 {0.5, NumberForm[0.5, {Infinity, 1}], {0.01, 0.}, {AbsoluteThickness[0.1]}}}

Note that all the numbers (except 0) are formatted with equal number of digits to the right of the decimal point:

Charting`ScaledTicks[{Identity, Identity}][0, .05, {10, 1}][[;; , ;; 2]]
{{0., 0}, 
 {0.005, NumberForm[0.005, {Infinity, 3}]}, 
 {0.01, NumberForm[0.01, {Infinity, 3}]}, 
 {0.015, NumberForm[0.015, {Infinity, 3}]}, 
 {0.02, NumberForm[0.02, {Infinity, 3}]}, 
 {0.025, NumberForm[0.025, {Infinity, 3}]}, 
 {0.03, NumberForm[0.03, {Infinity, 3}]}, 
 {0.035, NumberForm[0.035, {Infinity, 3}]}, 
 {0.04, NumberForm[0.04, {Infinity, 3}]}, 
 {0.045, NumberForm[0.045, {Infinity, 3}]}, 
 {0.05, NumberForm[0.05, {Infinity, 3}]}}

Here is how the above can be incorporated into your ticksHelper function:

ticksHelper[min_, max_] := 
 Module[{out = Charting`ScaledTicks[{Identity, Identity}][min, max, 6][[;; , ;; 2]]}, 
  If[out[[-1, 1]] < max, AppendTo[out, {max, "> " <> ToString@max}], 
   out[[-1, -1]] = "> " <> ToString@max];
  out]

min = 0;
max = 3;
Plot[Sin[x], {x, -6, 6}, Frame -> True, 
 FrameTicks -> {{None, None}, {None, ticksHelper[min, max]}}, ImageSize -> 500]

plot

$\endgroup$
4
  • $\begingroup$ Can you incorporate your solution into the ticksHelper module of the original post? $\endgroup$
    – Vaggelis_Z
    Commented Mar 10, 2017 at 9:20
  • $\begingroup$ @Vaggelis_Z I updated the answer. $\endgroup$ Commented Mar 10, 2017 at 10:52
  • $\begingroup$ @Vaggelis_Z so having 5 or 7 ticks is also acceptable? $\endgroup$
    – LLlAMnYP
    Commented Mar 10, 2017 at 11:45
  • $\begingroup$ @LLlAMnYP Well, anything between 5 and 7 ticks is acceptable. $\endgroup$
    – Vaggelis_Z
    Commented Mar 10, 2017 at 12:17

Your Answer

By clicking “Post Your Answer”, you agree to our terms of service and acknowledge you have read our privacy policy.

Not the answer you're looking for? Browse other questions tagged or ask your own question.