3
$\begingroup$

I'm new to Mathematica, and I'm writing a math research paper and I need to generate a phase portrait of the following system of polar equations

$\qquad \dot r=r(r-1)(r-2)$

$\qquad \dot \theta=1$

where $r$ and $\theta$ are the polar radial and angular coordinates, respectively, both are functions of $t$, and the dots mean derivative with respect to $t$.

All the equations I've used up until now have been in Cartesian coordinates; as an example, for the system

$\qquad \dot x = y$

$\qquad \dot y = -x + y(1-x^2)$

I used the following Mathematica commands to generate a phase portrait (with one particular solution):

p1 = 
  StreamPlot[{y, -x + -y*x^2 + y}, {x, -4, 4}, {y, -4, 4}, 
    Axes -> True, StreamStyle -> Gray, ImageSize -> Large]

deq1 = x'[t] == y[t];

deq2 = y'[t] == -x[t] + y[t] (1 - x[t]^2);

solution1 = 
  NDSolve[{deq1, deq2, x[0] == .0001, y[0] == .0001}, {x[t], y[t]}, {t, 0, 100}]

p2 = 
  ParametricPlot[Evaluate[{x[t], y[t]} /. solution1], {t, 0, 100}, 
   PlotStyle -> Thickness[0.005]]

Show[p1, p2, ImageSize -> Large]

Also, I found, through a google search, one way to generate a polar stream plot:

field1 = {r (r - 1) (r - 2), 1}

StreamPlot[
  Evaluate @ TransformedField["Polar" -> "Cartesian", field1, {r, θ} -> {x, y}], 
  {x, -3, 3}, {y, -3, 3}, 
  Axes -> True, StreamStyle -> Gray, ImageSize -> Large]

However, I do not know how to plot particular solutions for this system to overlay onto the stream plot like I did with the Cartesian systems. Does anyone know how to do this in Mathematica?

$\endgroup$
0

1 Answer 1

3
$\begingroup$

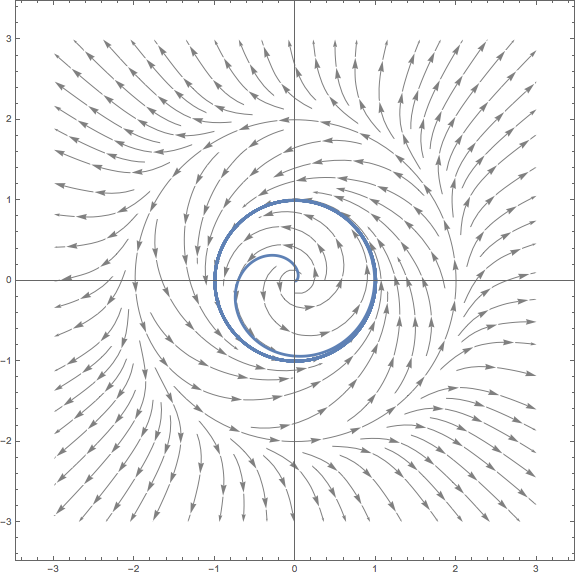
Here's an approach that uses FromPolarCoordinates. Note that Mod is required to handle situations when θ is outside the range [-π,π].

field1 = {r (r - 1) (r - 2), 1};

p1 = StreamPlot[Evaluate@TransformedField["Polar" -> "Cartesian", field1, {r, θ} -> {x, y}],
{x, -3, 3}, {y, -3, 3}, Axes -> True, StreamStyle -> Gray, ImageSize -> Large];

solution1 = NDSolve[{r'[t] == r[t] (r[t] - 1) (r[t] - 2), θ'[t] == 1, r[0] == 0.01, θ[0] == 0},
{r, θ}, {t, 0, 100}];

p2 = ParametricPlot[Evaluate[FromPolarCoordinates[{r[t], Mod[θ[t], 2 π, -π]}] /. solution1],
{t, 0, 100}, PlotStyle -> Thickness[0.005]];

Show[p1, p2, ImageSize -> Large]

Mathematica graphics

Looking at the origin, the StreamPlot looks a little wonky compared to the numerical solution -- I don't think the solution should cross a flow arrow like that!

Update: Since you don't have FromPolarCoordinates, it should be easy enough to roll your own:

FromPolarCoordinates[{r_, θ_}] := {r Cos[θ], r Sin[θ]};
$\endgroup$
5
  • $\begingroup$ Thank you so much for answering. This is exactly what I was looking for. I agree with the wonky StreamPlot, is there something that can be done about that, or is it just a numerical error made by the software? $\endgroup$ Commented Nov 27, 2016 at 1:27
  • $\begingroup$ @AlteredReality sorry, no clue $\endgroup$
    – Chris K
    Commented Nov 27, 2016 at 1:59
  • $\begingroup$ I just ran the code, and it didn't generate the numerical solution. Then I found out that FromPolarCoordinates only works with Mathematica versions 10+, but I have 9. Is there another way that you know of to generate this plot? $\endgroup$ Commented Dec 3, 2016 at 3:59
  • $\begingroup$ @AlteredReality Sure, see my update $\endgroup$
    – Chris K
    Commented Dec 4, 2016 at 3:15
  • $\begingroup$ It worked! Thank you so much for that $\endgroup$ Commented Dec 4, 2016 at 4:52

Your Answer

By clicking “Post Your Answer”, you agree to our terms of service and acknowledge you have read our privacy policy.

Not the answer you're looking for? Browse other questions tagged or ask your own question.