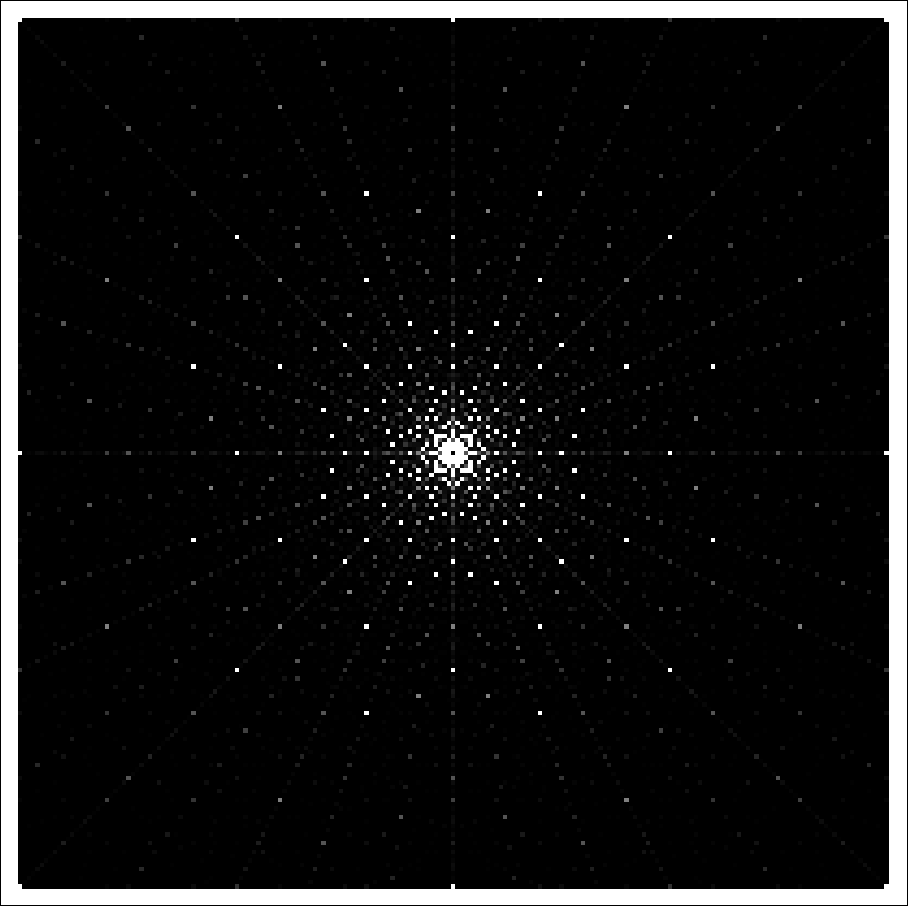
I recently saw this post on math.stackexchange and was curious as to how to generate the image in Mathematica. I tried the following naive approach; however, it is extremely slow.
Clear[check, GaussianIntegerQ]
GaussianIntegerQ[a_] := If[IntegerQ[Re[a]] && IntegerQ[Im[a]], True, False]
check[a_] := Block[{d = 0},Do[If[GaussianIntegerQ[c (1 + I)/a], d++], {c, 1, 100}]; d];
ArrayPlot[ParallelTable[If[a != 0 || b != 0, check[a + b I], 0], {a, -1, 1, 1/100},
          {b,-1, 1, 1/100}], ColorFunction -> (GrayLevel[#] &)] // AbsoluteTiming

(*{22.5931794, img}*)
I tried making it faster, but the speed-up wasn't much:
Clear[check]
check[a_, b_] := Block[{d = 0},Do[If[IntegerQ[(a c + b c)/(a^2 + b^2)] &&
    IntegerQ[(a c - b c)/(a^2 + b^2)], d++], {c, 1, 100}]; d]
ArrayPlot[ParallelTable[If[a != 0 || b != 0, check[a, b], 0], {a, -1, 1,1/100},
          {b, -1, 1, 1/100}], ColorFunction -> (GrayLevel[#] &)] // AbsoluteTiming

(*{15.5660219, img}*)
Could anyone offer suggestions on how to make it faster? (for what it's worth, here is C-code from a comment on the blog post)
The final result should look something like:


