I posted this question in math.se but given the sheer tumultuous number of questions that keep appearing on math.se and also given that I am trying to accomplish this in Mathematica, I thought I'd post an alternate version of this question here. (I hope that's not totally unacceptable to quasi-reproduce my question from elsewhere). I do realize that I'll receive perhaps different flavors of an answer from math.se and mathematica.se.
Simply put, given two sets of data (Discrete Fourier transform matrices in this case), how do I prove similarity in the data.
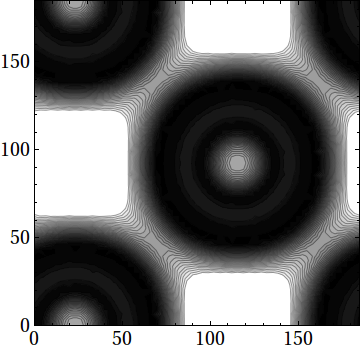
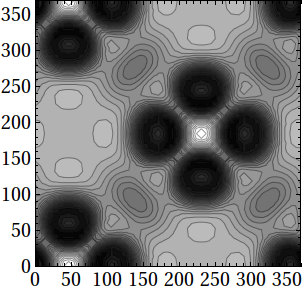
Comparing the figure on the Left with that on the Right, I somehow have an inkling that theres similarity in the figures.
What I have is DFT data for these figures too (just the top left corner of the DFT data, with the DC component removed), which looks so:
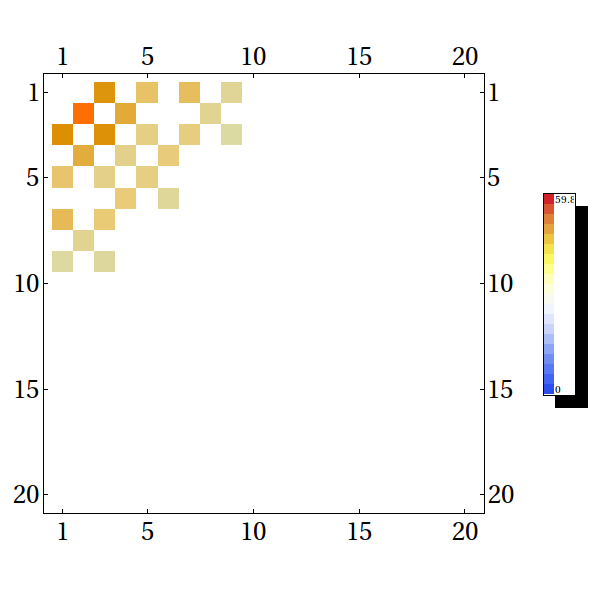
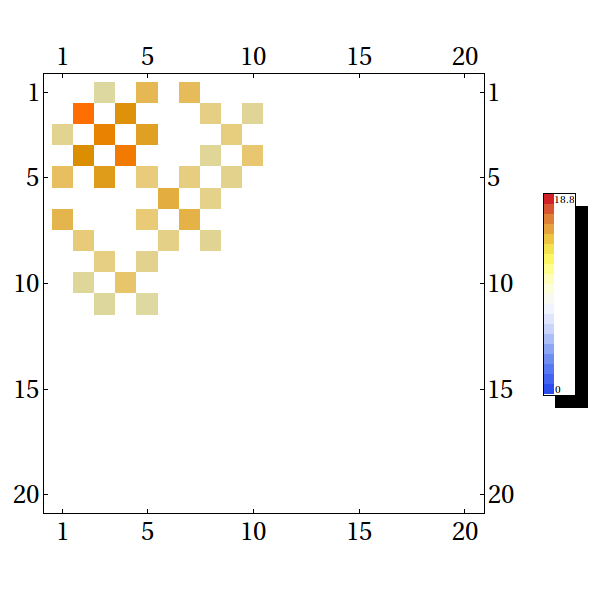
The DFT corner on the left is for the contour plot on the left and the one on the right is for the contour plot on the right.
I did a bit of research and came up with these: self similarity matrix, Smith Waterman algorithm for gene sequencing, it is implemented in Mathematica (also see ref/SmithWatermanSimilarity), and a somewhat related question posted on Mathematica.SE several months ago.
I understand that this is more math related than Mathematica related but as I'd like to use Mathematica since I pre and post process my data in it, I thought I'd ...ask! :)
I used the MatrixPlot to generate the plots from the data below.
Here is DFT data for the figure on the left:
{{0, 0., 23.1306, 0., 4.63337, 0., 4.87462, 0., 1.13912, 0., 0., 0.,
  0., 0., 0., 0., 0., 0., 0., 0.}, {0., 59.8403, 0., 11.402, 0., 0.,
  0., 1.53024, 0., 0., 0., 0., 0., 0., 0., 0., 0., 0., 0.,
  0.}, {23.3079, 0., 23.2309, 0., 3.80344, 0., 4.07117, 0., 1.07381,
  0., 0., 0., 0., 0., 0., 0., 0., 0., 0., 0.}, {0., 11.3638, 0.,
  3.51212, 0., 4.17147, 0., 0., 0., 0., 0., 0., 0., 0., 0., 0., 0.,
  0., 0., 0.}, {4.56479, 0., 3.80023, 0., 4.05799, 0., 0., 0., 0., 0.,
   0., 0., 0., 0., 0., 0., 0., 0., 0., 0.}, {0., 0., 0., 4.1947, 0.,
  1.12046, 0., 0., 0., 0., 0., 0., 0., 0., 0., 0., 0., 0., 0.,
  0.}, {5.12425, 0., 4.21734, 0., 0., 0., 0., 0., 0., 0., 0., 0., 0.,
  0., 0., 0., 0., 0., 0., 0.}, {0., 1.54858, 0., 0., 0., 0., 0., 0.,
  0., 0., 0., 0., 0., 0., 0., 0., 0., 0., 0., 0.}, {1.07898, 0.,
  1.094, 0., 0., 0., 0., 0., 0., 0., 0., 0., 0., 0., 0., 0., 0., 0.,
  0., 0.}, {0., 0., 0., 0., 0., 0., 0., 0., 0., 0., 0., 0., 0., 0.,
  0., 0., 0., 0., 0., 0.}, {0., 0., 0., 0., 0., 0., 0., 0., 0., 0.,
  0., 0., 0., 0., 0., 0., 0., 0., 0., 0.}, {0., 0., 0., 0., 0., 0.,
  0., 0., 0., 0., 0., 0., 0., 0., 0., 0., 0., 0., 0., 0.}, {0., 0.,
  0., 0., 0., 0., 0., 0., 0., 0., 0., 0., 0., 0., 0., 0., 0., 0., 0.,
  0.}, {0., 0., 0., 0., 0., 0., 0., 0., 0., 0., 0., 0., 0., 0., 0.,
  0., 0., 0., 0., 0.}, {0., 0., 0., 0., 0., 0., 0., 0., 0., 0., 0.,
  0., 0., 0., 0., 0., 0., 0., 0., 0.}, {0., 0., 0., 0., 0., 0., 0.,
  0., 0., 0., 0., 0., 0., 0., 0., 0., 0., 0., 0., 0.}, {0., 0., 0.,
  0., 0., 0., 0., 0., 0., 0., 0., 0., 0., 0., 0., 0., 0., 0., 0.,
  0.}, {0., 0., 0., 0., 0., 0., 0., 0., 0., 0., 0., 0., 0., 0., 0.,
  0., 0., 0., 0., 0.}, {0., 0., 0., 0., 0., 0., 0., 0., 0., 0., 0.,
  0., 0., 0., 0., 0., 0., 0., 0., 0.}, {0., 0., 0., 0., 0., 0., 0.,
  0., 0., 0., 0., 0., 0., 0., 0., 0., 0., 0., 0., 0.}}
And data for the figure on the right:
{{0, 0., 0.940723, 0., 2.95705, 0., 2.92228, 0., 0., 0., 0., 0., 0.,
  0., 0., 0., 0., 0., 0., 0.}, {0., 18.867, 0., 7.68905, 0., 0., 0.,
  1.61012, 0., 1.07367, 0., 0., 0., 0., 0., 0., 0., 0., 0.,
  0.}, {1.28581, 0., 12.1276, 0., 6.00817, 0., 0., 0., 1.7524, 0., 0.,
   0., 0., 0., 0., 0., 0., 0., 0., 0.}, {0., 8.01748, 0., 14.725, 0.,
  0., 0., 1.05116, 0., 2.1411, 0., 0., 0., 0., 0., 0., 0., 0., 0.,
  0.}, {2.77763, 0., 6.2871, 0., 1.82885, 0., 1.65436, 0., 1.43276,
  0., 0., 0., 0., 0., 0., 0., 0., 0., 0., 0.}, {0., 0., 0., 0., 0.,
  3.54584, 0., 1.45959, 0., 0., 0., 0., 0., 0., 0., 0., 0., 0., 0.,
  0.}, {3.11339, 0., 0., 0., 1.89853, 0., 3.24873, 0., 0., 0., 0., 0.,
   0., 0., 0., 0., 0., 0., 0., 0.}, {0., 1.83295, 0., 0., 0., 1.57703,
   0., 1.14208, 0., 0., 0., 0., 0., 0., 0., 0., 0., 0., 0., 0.}, {0.,
  0., 1.61293, 0., 1.32478, 0., 0., 0., 0., 0., 0., 0., 0., 0., 0.,
  0., 0., 0., 0., 0.}, {0., 1.02113, 0., 2.18193, 0., 0., 0., 0., 0.,
  0., 0., 0., 0., 0., 0., 0., 0., 0., 0., 0.}, {0., 0., 0.976133, 0.,
  0.931741, 0., 0., 0., 0., 0., 0., 0., 0., 0., 0., 0., 0., 0., 0.,
  0.}, {0., 0., 0., 0., 0., 0., 0., 0., 0., 0., 0., 0., 0., 0., 0.,
  0., 0., 0., 0., 0.}, {0., 0., 0., 0., 0., 0., 0., 0., 0., 0., 0.,
  0., 0., 0., 0., 0., 0., 0., 0., 0.}, {0., 0., 0., 0., 0., 0., 0.,
  0., 0., 0., 0., 0., 0., 0., 0., 0., 0., 0., 0., 0.}, {0., 0., 0.,
  0., 0., 0., 0., 0., 0., 0., 0., 0., 0., 0., 0., 0., 0., 0., 0.,
  0.}, {0., 0., 0., 0., 0., 0., 0., 0., 0., 0., 0., 0., 0., 0., 0.,
  0., 0., 0., 0., 0.}, {0., 0., 0., 0., 0., 0., 0., 0., 0., 0., 0.,
  0., 0., 0., 0., 0., 0., 0., 0., 0.}, {0., 0., 0., 0., 0., 0., 0.,
  0., 0., 0., 0., 0., 0., 0., 0., 0., 0., 0., 0., 0.}, {0., 0., 0.,
  0., 0., 0., 0., 0., 0., 0., 0., 0., 0., 0., 0., 0., 0., 0., 0.,
  0.}, {0., 0., 0., 0., 0., 0., 0., 0., 0., 0., 0., 0., 0., 0., 0.,
  0., 0., 0., 0., 0.}}

:)Thank you for your answer/comment! $\endgroup$