6
$\begingroup$

I'm numerically solving a PDE (time+1D space) with NDSolve and want to plot some spatial profiles. Plot works, but is very slow compared to ListPlot. Here's an example (Fisher-KPP equation):

l = 100;
tmax = 30;
pts = 1000;

sol = NDSolve[{
  D[n[x, t], t] == n[x, t] (1 - n[x, t]) + D[n[x, t], {x, 2}],
  n[x, 0] == If[45 < x < 55, 1, 0], n[0, t] == n[l, t]}, {n}, {t, 0, tmax}, {x, 0, l}, 
  Method -> {"MethodOfLines", "SpatialDiscretization" -> {"TensorProductGrid", "MaxPoints" -> pts}}
][[1]];

First@Timing[Plot[Evaluate[n[x, 15] /. sol], {x, 0, l}]]
(* 13.0701 *)

First@Timing[ListLinePlot[Table[{x, n[x, 15] /. sol}, {x, 0, l}]]]
(* 0.064737 *)

Can Plot be sped up? Maybe there is a nice way to extract a 1D InterpolatingFunction slice from a 2D InterpolatingFunction?

$\endgroup$
1
  • 1
    $\begingroup$ If you don't need too much accuracy, FunctionInterpolation[] is usable for slicing. $\endgroup$ Commented Oct 14, 2016 at 21:19

3 Answers 3

4
$\begingroup$

Extract the appropriate values and re-interpolate. If we extract the derivative values (optional), you get the normal cubic Hermite interpolation type produced by NDSolve on a first-order ODE. If t is a grid point, then the derivatives at the values of x on the grid should be stored (as computed from the PDE) in the InterpolatingFunction. Between grid points, these will be interpolated. It makes little difference to the plot, so you can omit and reduce the time a little more.

(if = n /. First@sol;
  grid = if["Grid"];
  slice = Interpolation@Transpose@{
      grid[[All, 1, {1}]],                (* extract x-grid *)
      if[grid[[All, 1, 1]], 15.],         (* extract n-values on x-grid at t == 15 *)
      Derivative[1, 0][if][grid[[All, 1, 1]], 15.] (* derivative values *)
     }) // AbsoluteTiming

Mathematica graphics

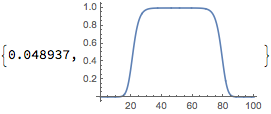
Plot[slice[x], {x, 0, 100}] // AbsoluteTiming

Mathematica graphics

$\endgroup$
2
  • $\begingroup$ Thanks, this is great! I used this as the basis for my own answer below. $\endgroup$
    – Chris K
    Commented Oct 15, 2016 at 15:11
  • $\begingroup$ What if I want a slice parallel to x-t plane, e.g. the locus of points where n[t,x]==1? $\endgroup$
    – user76455
    Commented Dec 27, 2020 at 11:23
3
$\begingroup$

@MichaelE2's slice-taking solution works great, but it's a bit cumbersome to use. Here's an idea based on it, which overloads the definition of InterpolatingFunction that makes it transparent to use, and also work on the other dimension.

Unprotect[InterpolatingFunction];

InterpolatingFunction[stuff___][var_Symbol, num_?NumericQ] := Module[{if, grid},
  if = InterpolatingFunction[stuff];
  grid = (InterpolatingFunction[stuff])["Grid"];

  Return[(Interpolation@Transpose@{
    grid[[All, 1, {1}]], (* extract x-grid *) 
    if[grid[[All, 1, 1]], num]
     })[var]]
];

InterpolatingFunction[stuff___][num_?NumericQ, var_Symbol] := Module[{if, grid},
  if = InterpolatingFunction[stuff];
  grid = (InterpolatingFunction[stuff])["Grid"];

  Return[(Interpolation@Transpose@{
    grid[[1, All, {2}]], (* extract t-grid *)
    if[num, grid[[1, All, 2]]]
     })[var]]
];

Protect[InterpolatingFunction];

In action:

l = 100;
tmax = 30;
pts = 1000; (* # grid points *)

sol = NDSolve[{
  D[n[x, t], t] == n[x, t] (1 - n[x, t]) + D[n[x, t], {x, 2}],
  n[x, 0] == If[45 < x < 55, 1, 0], n[0, t] == n[l, t]}, {n}, {t, 0, tmax}, {x, 0, l}, 
  Method -> {"MethodOfLines", 
  "SpatialDiscretization" -> {"TensorProductGrid", "MaxPoints" -> pts}}][[1]];

First@Timing[Plot[Evaluate[n[x, 15] /. sol], {x, 0, l}]]
(* 0.3865 *)

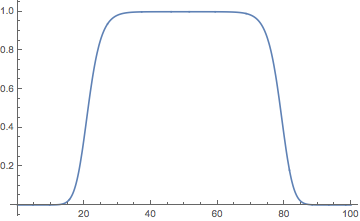
Plot[Evaluate[n[x, 15] /. sol], {x, 0, l}]

Mathematica graphics

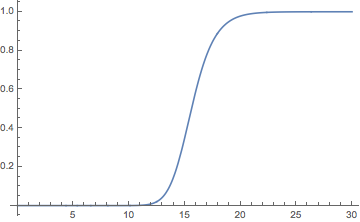
Plot[Evaluate[n[20, t] /. sol], {t, 0, tmax}]

Mathematica graphics

This is my first attempt at modifying built-in functions, so let me know if it might be improved or if it might break anything!

$\endgroup$
1
  • 1
    $\begingroup$ I've since been warned that modifying built-in commands is generally bad practice. This solution worked nicely for me, but use it at your own risk! $\endgroup$
    – Chris K
    Commented Oct 31, 2016 at 23:43
2
$\begingroup$

Another idea is to use NDSolveValue to extract the slice for you.

if = n /. First @ sol;
slice = NDSolveValue[
    {g'[x] == Derivative[1,0][if][x,15], g[0]==if[0,15]}, 
    g,
    {x, 0, 100}
];

Visualization:

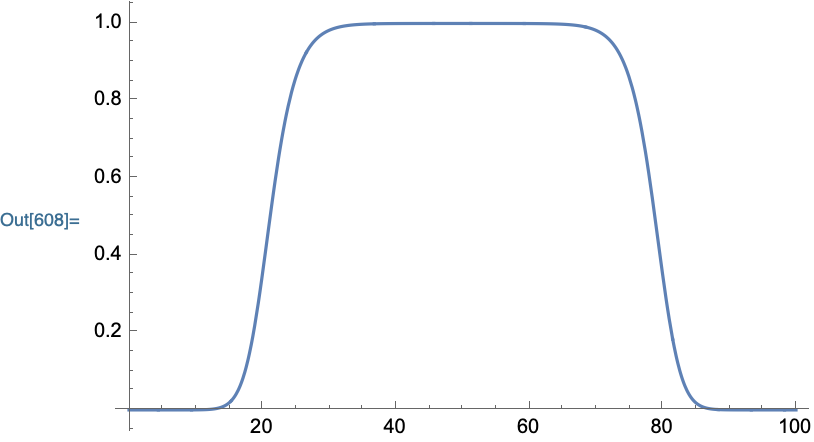
Plot[slice[x], {x, 0, 100}]

enter image description here

$\endgroup$

Your Answer

By clicking “Post Your Answer”, you agree to our terms of service and acknowledge you have read our privacy policy.

Not the answer you're looking for? Browse other questions tagged or ask your own question.