Please consider :
allTeamsOf5 = Subsets[Range[12], {5}];

rosterRandomAttributes = Table[Table[Round[RandomReal[], .1], {10}], {12}];

rosterRAMean = Mean@rosterRandomAttributes;

rosterRASD = StandardDeviation@rosterRandomAttributes;

allTeamStats = rosterRandomAttributes[[allTeamsOf5[[#]]]] & /@
               Range[Length@allTeamsOf5];

allTeamAverageStats = Mean /@ (allTeamStats[[#]]\[Transpose]) & /@ Range[792];

allTeamsDistToMean =
Total[(allTeamAverageStats[[#]] - rosterRAMean)/rosterRASD] & /@ Range[792];

distToMean = (rosterRandomAttributes[[#]] - rosterRAMean) & /@ Range[12];
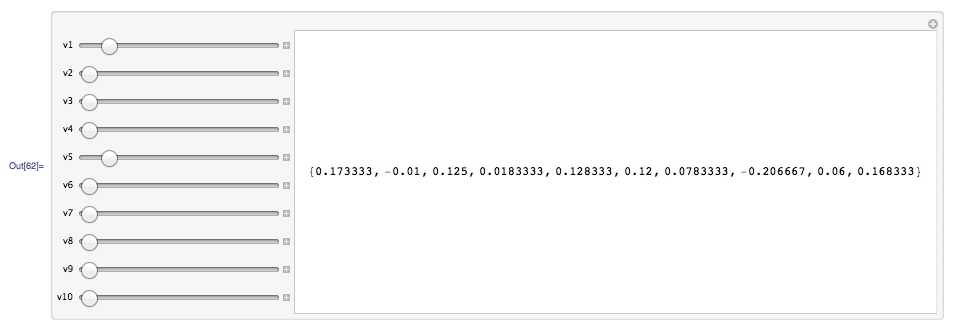
The below essentially compute the best team we can get out of this roster emphasizing on different attribute through weight. It output a list of 10 value representing the distance to the mean for each.
Manipulate[(Flatten@
    allTeamAverageStats[[
     Flatten@Position[
       Total[{v1, v2, v3, v4, v5, v6, v7, v8, v9, v10}/
       Total@{v1, v2, v3, v4, v5, v6, v7, v8, v9, v10} (
       allTeamAverageStats[[#]] - rosterRAMean)/rosterRASD] & /@
    Range[792],
   Max[Total[{v1, v2, v3, v4, v5, v6, v7, v8, v9, v10}/
        Total@{v1, v2, v3, v4, v5, v6, v7, v8, v9, v10} (
        allTeamAverageStats[[#]] - rosterRAMean)/rosterRASD] & /@
     Range[792]]]]]) - rosterRAMean,
 {v1, Range[.1, 1, .1]},
 {v2, Range[.1, 1, .1]},
 {v3, Range[.1, 1, .1]},
 {v4, Range[.1, 1, .1]},
 {v5, Range[.1, 1, .1]},
 {v6, Range[.1, 1, .1]},
 {v7, Range[.1, 1, .1]},
 {v8, Range[.1, 1, .1]},
 {v9, Range[.1, 1, .1]},
 {v10, Range[.1, 1, .1]}, ControlType -> Manipulator]

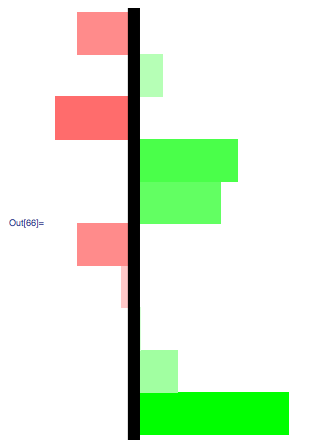
Now I would like the result of that manipulate to feed the below plot : (using solution posted on How can I create a ColorFunction using Blend? )
Show[
 Function[attributes,
   Graphics[{
   Blend[{
   {-Max[Abs[distToMean[[1]]]], Red},
   {0, LightRed}, {0, LightGreen},
   {+Max[Abs[distToMean[[1]]]], Green}},
  distToMean[[1]][[attributes]]],
 Rectangle[{If[distToMean[[1]][[attributes]] < 0,
    distToMean[[1]][[attributes]]*10, 0],
   attributes - 1}, {If[distToMean[[1]][[attributes]] < 0, 0,
    distToMean[[1]][[attributes]]*10], attributes}],
 PlotRange -> {{-6, 6}, {0, 10}}}, AspectRatio -> 16/9,
Epilog -> {Black, Thickness[.05], Line[{{0, 0}, {0, 11}}]}]] /@
Range[10], Frame -> False, FrameTicks -> False]

I would like the output of the manipulate to feed the Graphics instead of distToMean[1] Trying to nest a With[] to avoid repeating the long code, failed for reason I came to understand. I still don`t know how I could solve my problem
