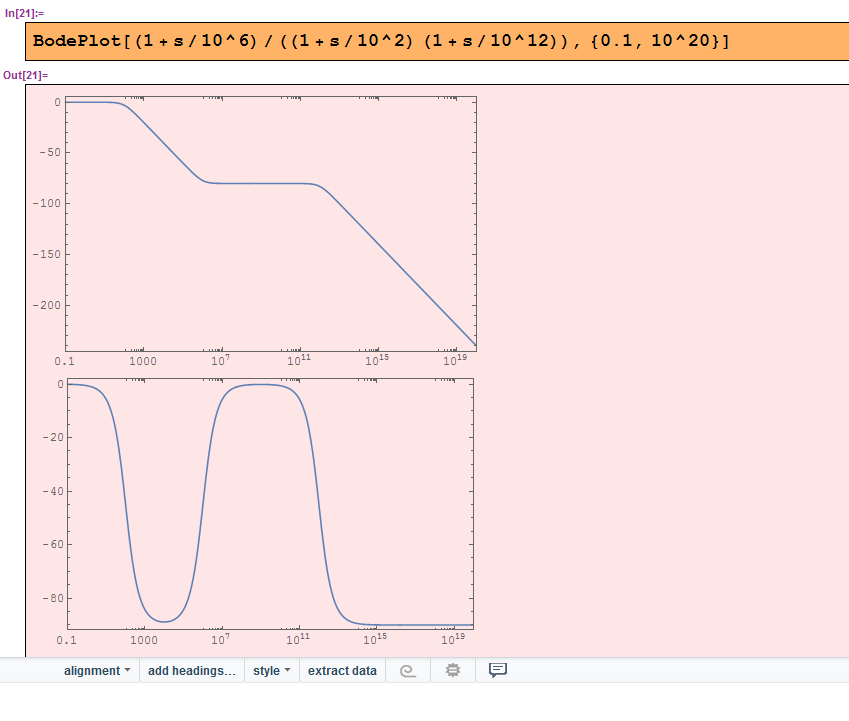
I used BodePlot function to plot the magnitude and phase for a transfer function as below.
BodePlot[(1+s/10^6)/((1+s/10^2) (1+s/10^12)),{0.1,10^20}]
Now I want to do the following things:
- Find the magnitude of the transfer function from the magnitude plot at 2*10^7 Hz.
- Find the phase of the transfer function from the phase plot at 2*10^7 Hz.
Is there a way to get exact these numbers? I tried to use Getcoordinate () function from drawing tool and then move cursor to that point but I only get the approximated result.


