5
$\begingroup$

I want to export the whole notebook to pdf. The notebook contains some rather large images. When I choose Save As then choose pdf, I find that the resulting pdf do not display the whole image. If the images are too wide, then only the left part is displayed. If it is too 'high', then the lower part will be shown on the next page (so a plot is split into two pages). How to solve this problem?

I tried choosing different options in the page setup and print setup, but it didn't work. Even if this cannot be solved easily, is it possible to at least show some gridlines (like in MS word/excel) so that I know how large the images can be without being chopped when I export them to pdf? I tried displaying the ruler, but it doesn't show the page size when I export it to pdf.

$\endgroup$
2

2 Answers 2

5
$\begingroup$

I suggest you embed your graphic in a size-controlled page.

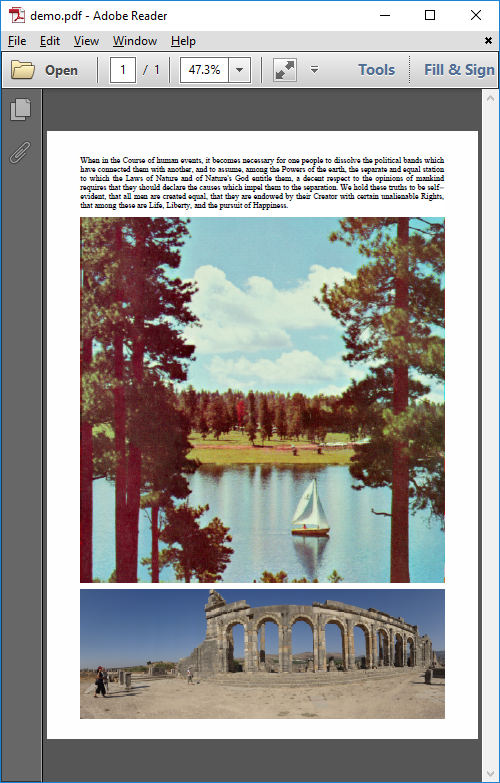
For example, displaying these differently sized images in one A4 PDF page.

sailboat = ExampleData[{"TestImage", "Sailboat"}];
volubilis = ExampleData[{"TestImage", "Volubilis"}];

ImageDimensions /@ {sailboat, volubilis}

{{512, 512}, {9010, 3791}}

Using a set page size (in this case set just for the current session), a PDF is created from a graphic. The inset image (or graphic) is displayed according to the page width. Just swap in different images and the page does the appropriate sizing.

SetOptions[$FrontEndSession,
 PrivateFontOptions -> {"OperatorSubstitution" -> False},
 PrintingOptions -> {
   "PrintingMargins" -> {{11, 43}, {15, 31}},
   "FirstPageHeader" -> False,
   "FirstPageFooter" -> False,
   "RestPagesHeader" -> False,
   "RestPagesFooter" -> False,
   "Magnification" -> 1}];

text = StringTake[ExampleData[{"Text", "DeclarationOfIndependence"}], 618];

page = Graphics[{White, Rectangle[{0, 0}, {700, 1080}], Black,

   Inset[TextCell[text, LineSpacing -> {0, 17},
     TextJustification -> 1], {0, 1080}, {Left, Top}, {700, Automatic}], 

   Inset[sailboat, {350, 610}, {Center, Center}, {700, 700}],
   Inset[volubilis, {350, 100}, {Center, Center}, {700, Automatic}]},

  PlotRange -> {{0, 700}, {0, 1080}}, ImageSize -> 700, 
  BaseStyle -> {FontFamily -> "Times", FontWeight -> "Plain", FontSize -> 15.5}];

nb = CreateDocument @ ExpressionCell[page, "Print"];
filename = "demo.pdf";
Quiet @ DeleteFile[filename];
Export[filename, nb];
NotebookClose[nb]

Output PDF

enter image description here

$\endgroup$
2
$\begingroup$

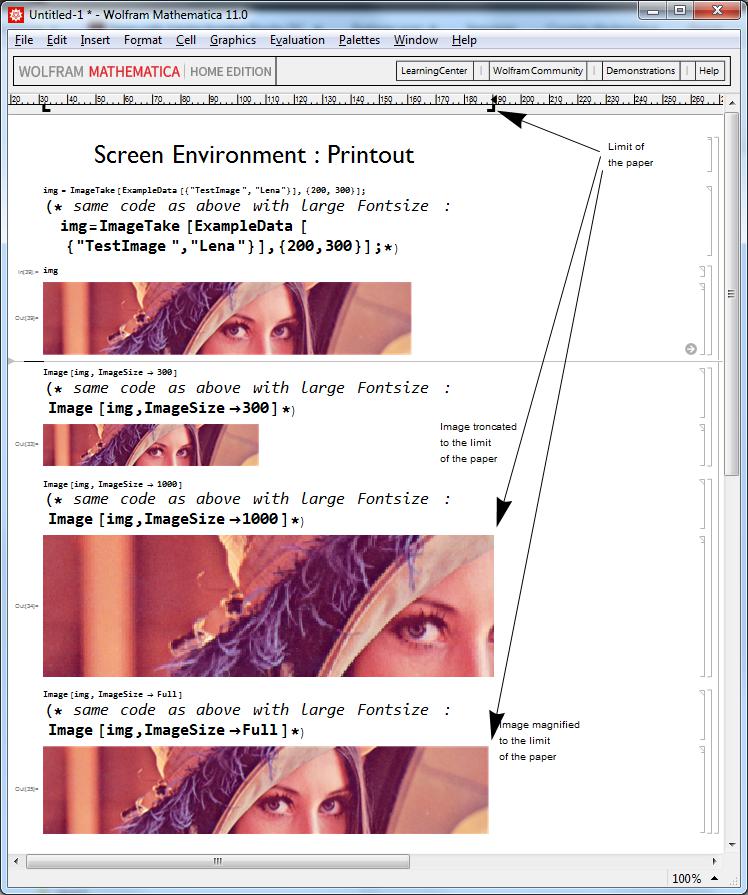
If you want to see how the images are cropped due to the limited paper width, use the ScreenEnvironment called "Printout" and show the ruler.

enter image description here

In the ruler, the tab indicating the limit of the paper is set automaticaly according to the printing settings (this may seem obvious, but may be not).

Note : By "limit of the paper" above, I mean "limit of the paper minus margins'

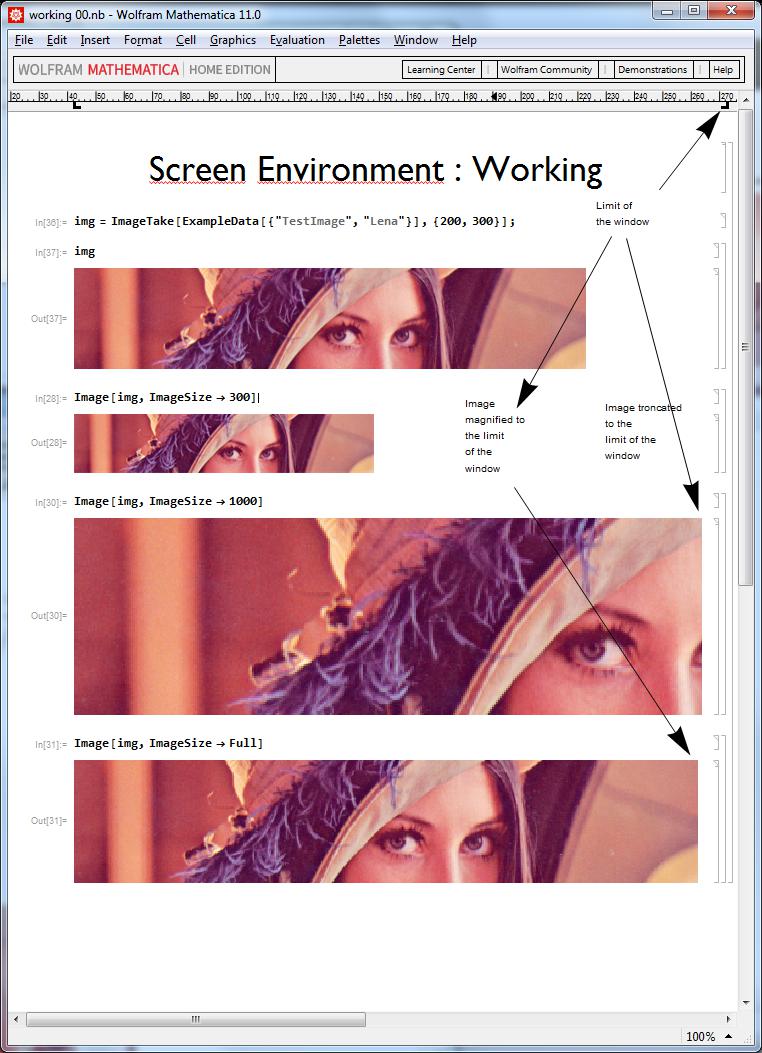
For comparaison here is the layout in the ScreenEnvironment "Working" :

enter image description here

$\endgroup$
0

Your Answer

By clicking “Post Your Answer”, you agree to our terms of service and acknowledge you have read our privacy policy.

Not the answer you're looking for? Browse other questions tagged or ask your own question.