5
$\begingroup$

I have a list plot:

Print[ListPlot[Table[RAveList[ntempc], {ntempc, 2, 12}], Joined -> True, 
   PlotRange -> All,  PlotStyle -> Table[colors[[ntempc]], {ntempc, 2, 12}], 
   PlotLegends -> 
    Placed[PointLegend[Table[colors[[ntempc]], {ntempc, 2, 12}], 
      Table[ntempc, {ntempc, 2, 12}], LegendMarkers -> Automatic], {Right, Top}], 
   Axes -> None, Frame -> True]];

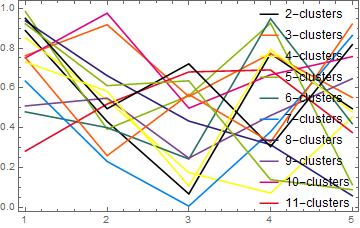
My code is as above. I have 11 data list to plot with labelling "2-clusters" to "12-clusters", where number 2 or 12 is a variable, and "-clusters" is fixed text.

I explain a little more. colors is a list of color names(i.e. Red, Blue... ). RAveList[ntempc] is data sample to plot with labelling $n$-clusters.

$\endgroup$
3
  • $\begingroup$ wasato, I formatted your code for legibility but it would be useful if you were to provide a self-contained example that people could evaluate directly. Also, you should not be using Print here apart from very specific applications. $\endgroup$
    – Mr.Wizard
    Commented Jul 23, 2016 at 14:24
  • 2
    $\begingroup$ If you have a List, Table is not necessary to extract a portion of the List, e.g., Table[colors[[ntempc]], {ntempc, 2, 12}] === colors[[2 ;; 12]] === Rest[colors] $\endgroup$
    – Bob Hanlon
    Commented Jul 23, 2016 at 14:40
  • 1
    $\begingroup$ If you were to omit the semicolon ( ; ) at the end of your code expression, you would not have wrap the ListPlot expression with Print. $\endgroup$
    – m_goldberg
    Commented Jul 23, 2016 at 21:00

2 Answers 2

5
$\begingroup$

Your example has several problems, why people can not directly run it. For example you have not provided RAveList and you use it as it was a function. I assume it is an array, but the answer can be easily adjusted. Here is an example of the labels you wanted.

RAveList = RandomReal[1, {25, 5}];
selection = 2 ;; 15;
labels = Array[StringTemplate["``-clusters"], 25][[selection]]
ListPlot[RAveList[[selection]], Joined -> True, PlotRange -> All, 
 PlotStyle -> ColorData[3, "ColorList"], 
 PlotLegends -> Placed[PointLegend[Automatic, labels], {Right, Top}], 
 Axes -> None, Frame -> True]

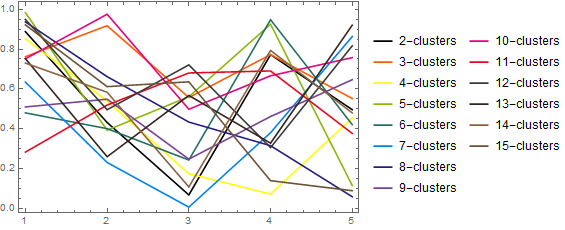
enter image description here

Edit - In case you use older Mathematica than v10 replace 3rd line with

labels = Array[ToString[#] <> "-clusters" &, 25]

Edit2 - Note that I parametrized shown subset of data using selection such that it would be easy to show different subsets on different plots. Code of the plot can be copy/pasted or turned into a function.

Note also, that you can use also selection={2,5,11} or selection=Range[2,5]~Join~Range[10,15].

Edit3 - In order to give unique colors to all 14 lines and not to have legends on top of data making it unreadable, I change OPs code further

ListPlot[RAveList[[selection]], Joined -> True, PlotRange -> All, 
 PlotStyle -> 
  Join[ColorData[3, "ColorList"], ColorData[4, "ColorList"]], 
 PlotLegends -> Placed[PointLegend[Automatic, labels], Right], 
 Axes -> None, Frame -> True]

enter image description here

$\endgroup$
10
  • $\begingroup$ Sorry to having several errors. People can not run it directly because RAveList is result data. I guess ... labels = Array[StringTemplate["``-clusters"], 25][[selection]]... this part is important. $\endgroup$
    – wasato
    Commented Jul 23, 2016 at 15:07
  • $\begingroup$ You can always give some dummy/random data which works for illustrating what you do. I would study the whole example to learn about some neat practices I demonstrated, which allows one to write shorter and more clear code. $\endgroup$
    – Johu
    Commented Jul 23, 2016 at 19:30
  • $\begingroup$ I find your code does not work for me, since StringTemplate is a new function after version 9. Others work well. Thanks. $\endgroup$
    – wasato
    Commented Jul 23, 2016 at 19:47
  • $\begingroup$ @wasato I added an alternative. $\endgroup$
    – Johu
    Commented Jul 23, 2016 at 19:58
  • $\begingroup$ Many thanks. It works well. $\endgroup$
    – wasato
    Commented Jul 23, 2016 at 20:04
5
$\begingroup$

There are some things that bother me in Johu's solution, so I am offering this alternative, which seems both simpler and better to me. This works with versions of Mathematica older than V10.

RAveList = RandomReal[1, {11, 5}];
colors = ColorData[97];
labels = Row[{#, "-clusters"}] & /@ Range[2, 12];
ListPlot[Thread[Tooltip[RAveList, labels]],
  Joined -> True,
  DataRange -> {0, 5},
  PlotStyle -> colors,
  PlotLegends -> labels,
  Axes -> None,
  Frame -> True]

plot

I have added tooltips to each cluster plot because I believe, with so many plots in one view, it easier for the viewer to determine which is which with a tooltip than with a plot legend, especially if the viewer has vision problems that make colors hard to distinguish.

$\endgroup$
4
  • $\begingroup$ +1 as I agree, that cleanup and tooltips add value. $\endgroup$
    – Johu
    Commented Jul 23, 2016 at 22:15
  • 1
    $\begingroup$ One can use PlotLegends -> LineLegend[labels, LegendLayout -> (Grid[#, Alignment -> Right] &)] to have all LineLegends in one column. $\endgroup$
    – Karsten7
    Commented Jul 23, 2016 at 22:33
  • $\begingroup$ Why wrap labels with Row? $\endgroup$
    – Johu
    Commented Jul 23, 2016 at 22:39
  • $\begingroup$ @Johu. I use Row because I find it to be the easiest way to create labels constructed from a mixture of expressions and strings. $\endgroup$
    – m_goldberg
    Commented Jul 24, 2016 at 0:35

Your Answer

By clicking “Post Your Answer”, you agree to our terms of service and acknowledge you have read our privacy policy.

Not the answer you're looking for? Browse other questions tagged or ask your own question.