7
$\begingroup$

img

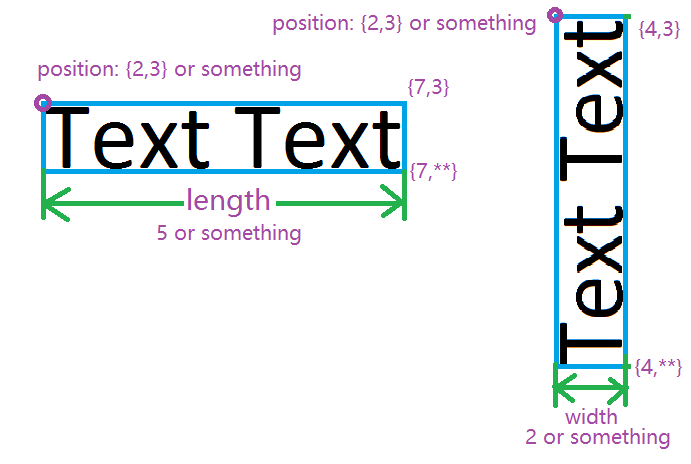
Note: all these coordinates are in Graphics system, not text size system. so specifying simply by Style[text, 5] or so won't work......

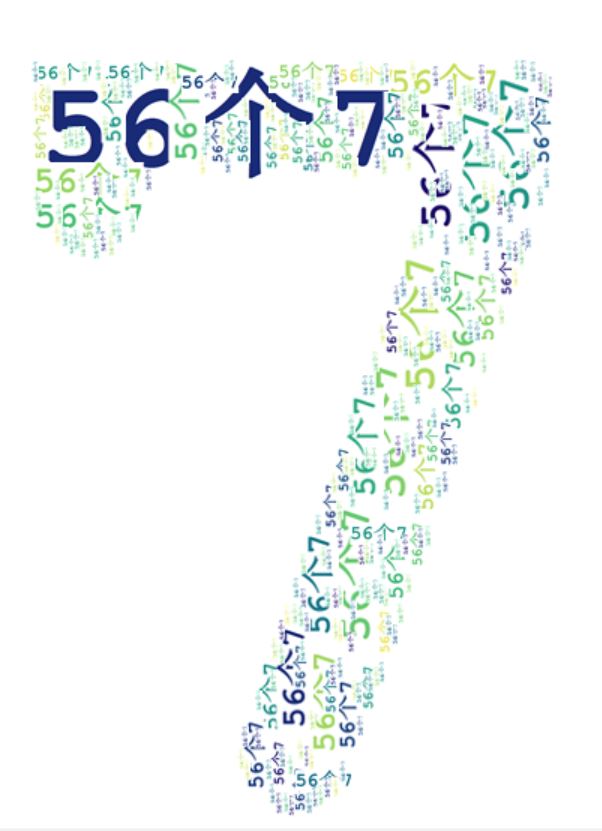
I have some text and I would like to show them in some order in Graphics, but I want them to be in certain size so it will looks good. (Primarily for improving my answer to this problem).

So, I can give the left top point's coordination and the length(in the first case) or the width(in the second) of the text.

How can I create a text just in this size? Surely Text[Style["Text Text",size],pos] won't work in this way.

Any help will be greatly appreciated. :)


Edit 1

Provide some data for experiment:

Text:"56个7"

Position data, given in {Position,size} pairs, when size's first part is larger that the second, it's parallel, and when not, horizontal:

{{{342, 135}, {189, 500}}, {{756, 590}, {232, 71}}, {{404, 707}, {232,
    71}}, {{954, 541}, {232, 71}}, {{381, 653}, {232, 71}}, {{1280, 
   457}, {76, 23}}, {{1155, 506}, {172, 53}}, {{607, 631}, {232, 
   71}}, {{357, 762}, {232, 71}}, {{623, 700}, {172, 53}}, {{988, 
   613}, {117, 36}}, {{502, 242}, {76, 23}}, {{1170, 440}, {117, 
   36}}, {{1121, 464}, {172, 53}}, {{992, 499}, {172, 53}}, {{337, 
   621}, {58, 160}}, {{865, 655}, {117, 36}}, {{335, 314}, {172, 
   53}}, {{800, 562}, {172, 53}}, {{474, 127}, {58, 160}}, {{523, 
   130}, {58, 160}}, {{1251, 419}, {117, 36}}, {{1195, 546}, {117, 
   36}}, {{377, 613}, {117, 36}}, {{354, 221}, {117, 36}}, {{753, 
   693}, {117, 36}}, {{630, 739}, {117, 36}}, {{383, 515}, {117, 
   36}}, {{383, 816}, {117, 36}}, {{923, 529}, {76, 23}}, {{406, 
   393}, {76, 23}}, {{681, 614}, {76, 23}}, {{359, 132}, {76, 
   23}}, {{1316, 486}, {76, 23}}, {{429, 498}, {76, 23}}, {{414, 
   464}, {76, 23}}, {{600, 773}, {76, 23}}, {{416, 372}, {76, 
   23}}, {{357, 363}, {38, 11}}, {{523, 192}, {76, 23}}, {{1175, 
   581}, {76, 23}}, {{350, 455}, {31, 80}}, {{427, 551}, {76, 
   23}}, {{1097, 604}, {76, 23}}, {{976, 649}, {76, 23}}, {{336, 
   232}, {31, 80}}, {{836, 689}, {76, 23}}, {{873, 547}, {76, 
   23}}, {{380, 644}, {76, 23}}, {{373, 748}, {38, 11}}, {{337, 
   132}, {31, 80}}, {{425, 447}, {76, 23}}, {{418, 483}, {76, 
   23}}, {{416, 407}, {76, 23}}, {{1180, 529}, {76, 23}}, {{611, 
   689}, {76, 23}}, {{1088, 485}, {38, 11}}, {{976, 566}, {31, 
   80}}, {{1146, 487}, {76, 23}}, {{341, 549}, {31, 80}}, {{832, 
   670}, {76, 23}}, {{412, 126}, {76, 23}}, {{1319, 492}, {31, 80}}}

Edit 2

Check my answer, now my only concern is that how to make White region totally transparent?

$\endgroup$
0

3 Answers 3

4
$\begingroup$

You can convert text to FilledCurve graphics primitives by converting via PDF. See here for example.

In the example below I get the bounding box of the resulting graphics using PlotRange, then use Scale and Translate to size and position the text as required.

t = Style["Text Text", FontFamily -> "Times New Roman", 60];

g = ImportString[ExportString[t, "PDF"]][[1, 1]];

{{a, b}, {c, d}} = PlotRange @ Graphics[g, PlotRange -> All, PlotRangePadding -> None]
(* {{1.29598, 168.789}, {9.56801, 38.5115}} *)

Graphics[
 Translate[Scale[g, 5/(b - a), {a, d}], {2, 3} - {a, d}],
 PlotRange -> All, PlotRangePadding -> None, Frame -> True]

enter image description here

$\endgroup$
1
  • $\begingroup$ this is quite helpful when generating high quality output! $\endgroup$
    – Wjx
    Commented Jul 2, 2016 at 14:21
5
$\begingroup$

You can convert your Text to Graphics and then use any size

 Show[ImageCrop@Graphics@Text@Style["Text Text", 80, Bold, FontFamily -> Times],
      ImageSize -> 200]

enter image description here

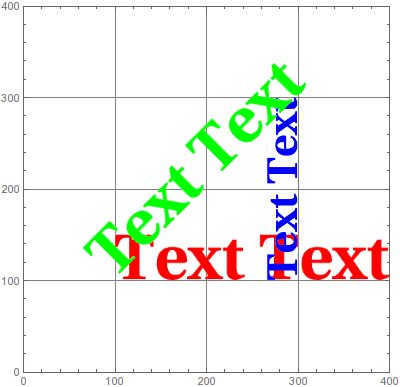
You can change the font size to get a better resolution. With a little modification you can use it inside a canvas in the way you want.

insert[txt_String, col_, pos_List, angle_, size_] := Module[{text},
text = ColorReplace[ImageCrop@Graphics@Text@Style[txt, col, 80, Bold,
FontFamily -> Times], White];
Inset[text, pos, {0,0}, size, {Cos[angle], Sin[angle]}]]

Graphics[{
insert["Text Text", Red, {100, 100}, 0, 300],
insert["Text Text", Blue, {300, 100}, Pi/2, 200],
insert["Text Text", Green, {100, 100}, Pi/4, 300]},
PlotRange -> {{0, 400}, {0, 400}}, GridLines -> Automatic, 
Frame -> True, ImageSize -> 400]

enter image description here

With proper control over size and position. pos is the coordinate of your bottom left corner of the text.

$\endgroup$
9
  • $\begingroup$ This is a good start, but how can I position them? I can only give out the coordination of the left top point. $\endgroup$
    – Wjx
    Commented Jul 1, 2016 at 13:32
  • $\begingroup$ edited, are there any idea to position those characters and format both position, angle, and textsize? $\endgroup$
    – Wjx
    Commented Jul 1, 2016 at 13:49
  • $\begingroup$ @Wjx Could you clarify what you are asking? It seems to me that Sumit's answer already provides control of position, angle, and text size. $\endgroup$
    – MarcoB
    Commented Jul 1, 2016 at 14:52
  • $\begingroup$ @MarcoB er, I suppose this answer cannot provide a control for position? check the link in my question, I'm trying to draw a word cloud like that, I've already got the position of the text and their size, just cannot show them elegantly. $\endgroup$
    – Wjx
    Commented Jul 1, 2016 at 15:18
  • $\begingroup$ @Wjx, I hope the modified answer would be useful. Previous answer did not work because I used ImageCrop to eliminate the extra white space. $\endgroup$
    – Sumit
    Commented Jul 1, 2016 at 16:18
1
$\begingroup$

First, I'll have to admit that those data should be modified a bit:

wd2="56个7";
dat={{#1[[1]], -#1[[2]]}, #2} & @@@ Map[Reverse, **Those data**, {2}];

Then, just following @Sumit's answer, we'll have to use Inset to do this job, but we need to further specify the alignment by using Inset's Third options. Then, we also need to use the size option(the fourth option) in Inset to make the graphics in our desired form.

In this way, we can easily rule out the actual form of the code:

Graphics[Inset[
    Rasterize[
     Style[wd2, ColorData["BlueGreenYellow"]@RandomReal[], Bold, 
      FontFamily -> Times], RasterSize -> 1000], #1, {Left, Top}, #2, 
    If[#2[[1]] > #2[[2]], {1, 0}, {0, 1}]] & @@@ dat, 
 PlotRange -> {{0, 1000}, {-2000, 0}}, ImageSize -> 800]

Though the result is still not satisfying, I think I'll post this first in hope that someone may further improve this code.


Edit 1

The alignment and size needs a bit more formatting while the text is rotated as these options will only specify the points before rotation:

Graphics[Inset[
    Rasterize[
     Style[wd2, ColorData["BlueGreenYellow"]@RandomReal[], Bold], 
     RasterSize -> 1000], #1, 
    If[#2[[1]] > #2[[2]], {Left, Top}, {Right, Top}], Reverse@Sort@#2,
     If[#2[[1]] > #2[[2]], {1, 0}, {0, 1}]] & @@@ dat, 
 PlotRange -> {{0, 1000}, {-2000, 0}}, ImageSize -> 800]

This time the result will be quite pleasing, and the only thing left is about opacity. Thanks for everyone!!!

result

$\endgroup$
1
  • $\begingroup$ "the only thing left is about opacity" - try ColorReplace[]. $\endgroup$ Commented Jul 2, 2016 at 12:42

Your Answer

By clicking “Post Your Answer”, you agree to our terms of service and acknowledge you have read our privacy policy.

Not the answer you're looking for? Browse other questions tagged or ask your own question.