0
$\begingroup$

On the following plot example, I get a division by zero error (10.4.1):

ListPointPlot3D[{{1, 1, 1}, {2, 2, 2}}, ColorFunction -> Function[{x, y, z}, ColorData["TemperatureMap"][1/x]]]
(*Power::infy: Infinite expression 1/0. encountered. >>*)

while there seems to be no problem with the ColorFunction:

Function[{x, y, z}, ColorData["TemperatureMap"][1/x]] @@@ {{1, 1, 1}, {2, 2, 2}}

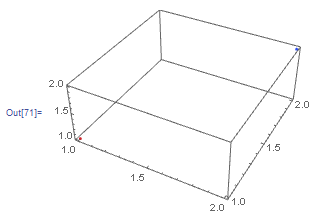
enter image description here

For what I could get, this is true also for other type of plots.

We can try to do the scaling ourselves (not that with the way it is defined this should matter).

MinMax[1/#[[1]] & /@ {{1, 1, 1}, {2, 2, 2}}]
(*{1/2, 1}*)

Rescale[1/#[[1]], MinMax[{1/2, 1}]] & /@ {{1, 1, 1}, {2, 2, 2}}
(*{1, 0}*)

But it works:

ListPointPlot3D[{{1, 1, 1}, {2, 2, 2}}, 
 ColorFunction -> Function[{x, y, z}, ColorData["TemperatureMap"][
 Rescale[1/x, MinMax[1/#[[1]] & /@ {{1, 1, 1}, {2, 2, 2}}]]]], 
 ColorFunctionScaling -> False]

enter image description here

What's going on? It seems that Mathematica is defining the color scale outside the plot range. If so, why?

$\endgroup$
2
  • $\begingroup$ It does seem to be the fault of the internal scaling. Running Trace[] on the plot shows that an expression like (Blend["TemperatureMap", 1/#1] &) @@ {1. (#1 - 1.), 1. (#2 - 1.), 1. (#3 - 1.)} & is being evaluated at your points, and that will indeed choke on {1, 1, 1}. $\endgroup$ Commented May 23, 2016 at 12:25
  • 4
    $\begingroup$ Possible duplicate of Use ColorFunction in ListLinePlot with If. Also related: (21684) and (23840). $\endgroup$
    – MarcoB
    Commented May 23, 2016 at 15:04

1 Answer 1

3
$\begingroup$

This is expected behavior since the values are all rescaled to lie between 0 and 1 prior to feeding them to the ColorFunction. So there will always be some portion of the plotted region that corresponds to a value of 0 and a region that corresponds to a value of 1.

Look at this simplified example,

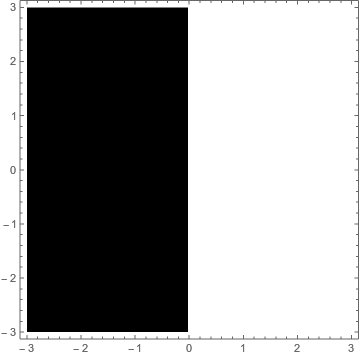
DensityPlot[2 + UnitStep[x], {x, -3, 3}, {y, -3, 3}, 
 ColorFunction -> (Which[# == 0, Black, # == 1, White, True, Red] &)]

Mathematica graphics

The function value is either 2 or 3 at every point in the range, but the ColorFunction only sees values of either 0 or 1.

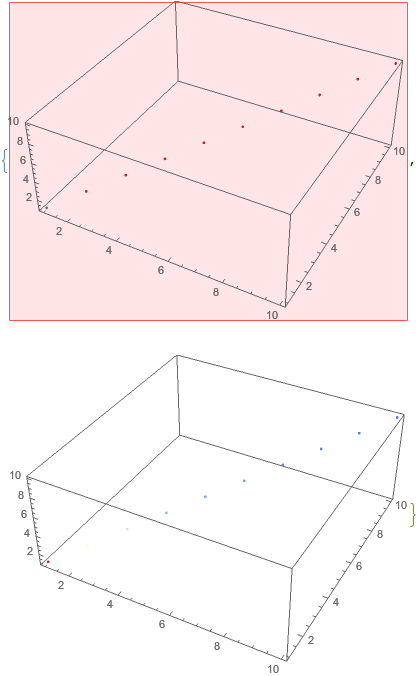
You need to turn ColorFunctionScaling to False in order for the colors to work the way you want them to

ListPointPlot3D[Array[{#, #, #} &, 10], 
   ColorFunction -> 
    Function[{x, y, z}, ColorData["TemperatureMap"][1/x]],
   ColorFunctionScaling -> #] & /@ {True, False}

Mathematica graphics

Notice you get the right colors here,

ColorData["TemperatureMap"][1/#] & /@ Range[10]

Mathematica graphics

$\endgroup$

Not the answer you're looking for? Browse other questions tagged or ask your own question.