I'm using NDSolveValue to solve Laplace's equation for a relatively simple system. I have two rectangles, separated by a small gap, which I define using RegionDifference:
\[CapitalOmega] =
  RegionDifference[
   RegionDifference[Rectangle[{0, 0}, {Last@simxbds, Last@simybds}],
    Rectangle[{0, hrect1}, {lrectbd, hrect2}]],
   Rectangle[{rrectbd, hrect1}, {Last@simxbds, hrect2}]];
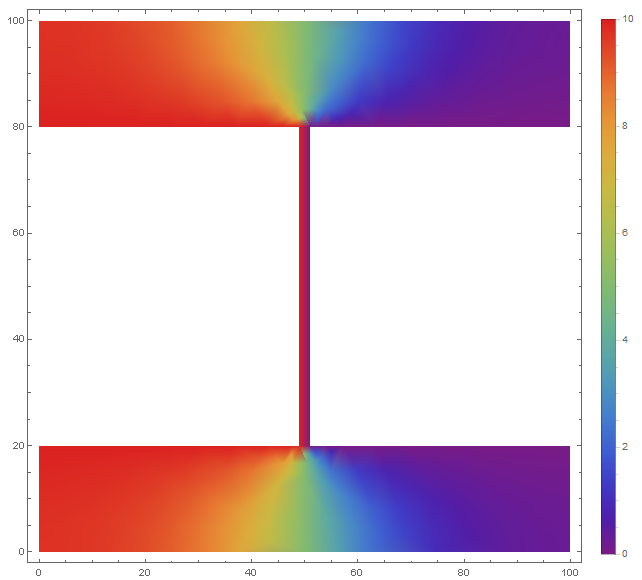
(The rectangles are obvious in the image below; they're the white rectangles.)
I set the boundary of one rectangle to be at 10 (Volts), and the other to be at 0. Then I use NDSolveValue to find the potential in the area outside the rectangles, like so:
sol = NDSolveValue[{D[u[x, y], x, x] + D[u[x, y], y, y] == 0,
    DirichletCondition[u[x, y] == Vapp,
     lrectsideBC || lrectbotBC || lrecttopBC],
    DirichletCondition[u[x, y] == 0.,
     rrectsideBC || rrectbotBC || rrecttopBC]},
   u, {x, y} \[Element] \[CapitalOmega]];
(the terms ending in BC are just the inequalities for defining the boundary conditions, which will become apparent in the image below.)
If I do a DensityPlot of the solution, it looks pretty good, ostensibly accurate:
However, what I really want to do is see the field lines. To do this, I just take the gradient of the solution and plot it with StreamPlot:
gradField = ComplexExpand[{D[sol[x, y], x], D[sol[x, y], y]}];
Show[DensityPlot[sol[x, y], {x, y} \[Element] \[CapitalOmega],
  Mesh -> None, ColorFunction -> "Rainbow", PlotRange -> All,
  PlotLegends -> Automatic, ImageSize -> Large],
 StreamPlot[gradField, {x, 0, 100}, {y, 0, 100}, ImageSize -> Large]]
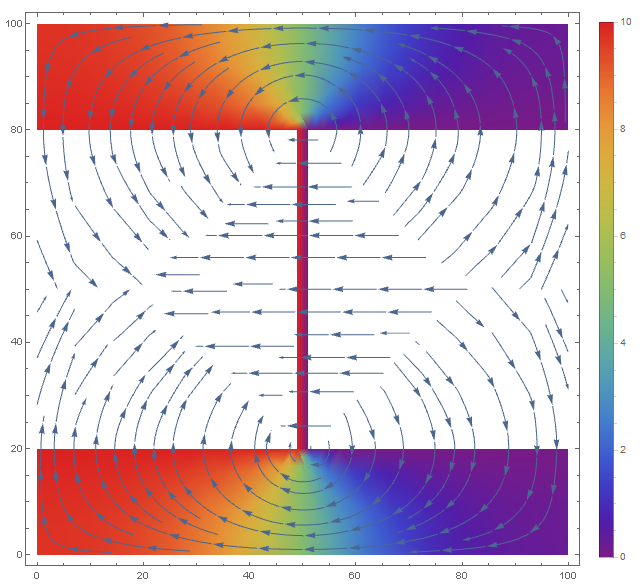
Which gives me this:
Now, this also looks pretty good, but what's worrying me is that there are field lines inside the rectangles, where NDSolveValue wasn't supposed to be solving, and those field lines look pretty crazy. Specifically, you can see where they look pretty discontinuous, at the "diamond" shape in the middle.
The field lines actually look okay in the region where NDSolveValue was supposed to work (they look like what you'd expect, and are perpendicular to the white rectangles, as they should be), but I'm still worried that whatever is causing those field lines inside the rectangles is influencing the solution in the region I actually care about.
Is this something to worry about, or just an artifact of NDSolveValue?
edit: to be clear, I'm not asking if the solution inside the rectangles (i.e., outside my NDSolve region) is accurate; I'm asking if I've set up the problem incorrectly because there is a strange solution inside (as opposed to no solution or something more trivial).
For example, if you look at this problem from a physical standpoint, if the two rectangles are conductors, there should be 0 field lines inside of them. I thought it may be caused by the fact that my boundary conditions only specified the values at the edges of the rectangles, like so:
lrectsideBC = (x == lrectbd && hrect1 <= y <= hrect2);
rrectsideBC = (x == rrectbd && hrect1 <= y <= hrect2);
lrectbotBC = (0 <= x <= lrectbd && y == hrect1);
lrecttopBC = (0 <= x <= lrectbd && y == hrect2);
rrectbotBC = (rrectbd <= x <= Last@simxbds && y == hrect1);
rrecttopBC = (rrectbd <= x <= Last@simxbds && y == hrect2);
So to be sure I tried also specifying the values inside:
lrectinterior = (0 <= x <= lrectbd && hrect1 <= y <= hrect2);
rrectinterior = (rrectbd <= x <= Last@simxbds &&
    hrect1 <= y <= hrect2);
But that didn't change the field lines.
Edit: Full code, lengthy:
Vapp = 10;
interfacewidth = 60;
separation = 2;
Clear[x, y];
simxbds = {0, 100};
simybds = {0, 100};
xandbds = Flatten@({x, simxbds});
yandbds = Flatten@({y, simybds});
ymidpt = (Last@simybds)/2;
hrect1 = ymidpt - interfacewidth/2.;
hrect2 = ymidpt + interfacewidth/2.;
xmidpt = (Last@simxbds)/2;
lrectbd = xmidpt - separation/2;
rrectbd = xmidpt + separation/2;
lrectsideBC = (x == lrectbd && hrect1 <= y <= hrect2);
rrectsideBC = (x == rrectbd && hrect1 <= y <= hrect2);
lrectbotBC = (0 <= x <= lrectbd && y == hrect1);
lrecttopBC = (0 <= x <= lrectbd && y == hrect2);
rrectbotBC = (rrectbd <= x <= Last@simxbds && y == hrect1);
rrecttopBC = (rrectbd <= x <= Last@simxbds && y == hrect2);

(*I don't think we need these BC's..?*)
lrectinterior = (0 <= x <= lrectbd && hrect1 <= y <= hrect2);
rrectinterior = (rrectbd <= x <= Last@simxbds &&
   hrect1 <= y <= hrect2);

\[CapitalOmega] =
 RegionDifference[
  RegionDifference[Rectangle[{0, 0}, {Last@simxbds, Last@simybds}],
   Rectangle[{0, hrect1}, {lrectbd, hrect2}]],
  Rectangle[{rrectbd, hrect1}, {Last@simxbds, hrect2}]];

sol = NDSolveValue[{D[u[x, y], x, x] + D[u[x, y], y, y] == 0,
   DirichletCondition[u[x, y] == Vapp,
    lrectsideBC || lrectbotBC || lrecttopBC(*||lrectinterior*)],
   DirichletCondition[u[x, y] == 0.,
    rrectsideBC || rrectbotBC || rrecttopBC(*||rrectinterior*)]},
  u, {x, y} \[Element] \[CapitalOmega]];


gradField = ComplexExpand[{D[sol[x, y], x], D[sol[x, y], y]}];


Print@Show[
     DensityPlot[sol[x, y], {x, y} \[Element] \[CapitalOmega],
      Mesh -> None, ColorFunction -> "Rainbow", PlotRange -> All,
      PlotLegends -> Automatic, ImageSize -> Large],
     StreamPlot[gradField, {x, y} \[Element] \[CapitalOmega],
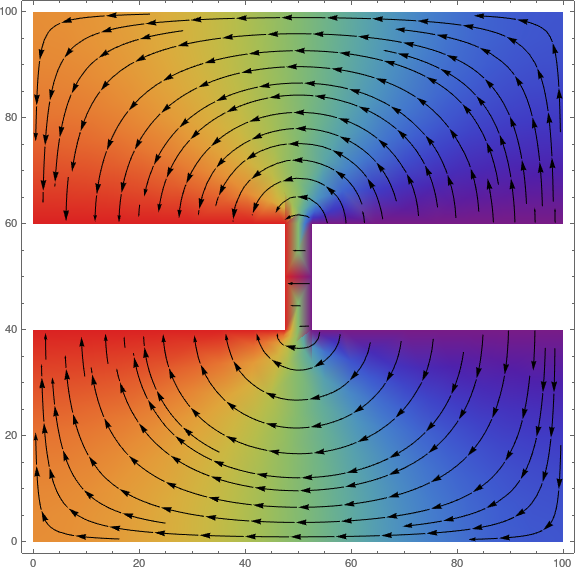
      StreamStyle -> Black, ImageSize -> Large]];


NDSolveoutside the integration domain for which they were calculated. $\endgroup$Vappis missing. $\endgroup$