Bug introduced in 8 or earlier and persists through 11.0.1 or later
I am trying to plot the following single variable function:
$$\small\frac{180 \sqrt{\pi ^2-625 t} \left(\pi ^2 (36 t-25)-1500 t \left(45 t-\sqrt{900 t-\pi ^2}-15\right)\right)}{\pi ^4 \sqrt{2500 t-\pi ^2}}+\tan \left(2 \sqrt{\pi ^2-625 t}\right)$$
with code:
Plot[(180 Sqrt[π^2-625 t] (π^2 (-25+36 t)-1500 t (-15+45 t-Sqrt[-π^2+900 t])))/(π^4 Sqrt[-π^2+2500 t])+Tan[2 Sqrt[π^2-625 t]],
{t,0.01,0.016},ImageSize->800,
(*AxesStyle->{{Directive[Red, 12],Arrowheads[.035],Thick},{Directive[Red, 12],Arrowheads[.035],Thick}},*)
PlotStyle->Blue]
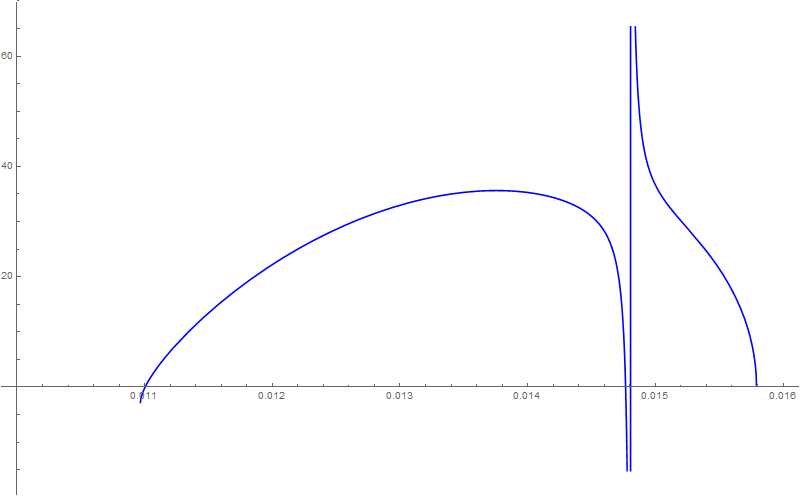
However, I have to comment the AxesStyle line above in order to obtain normal image size:
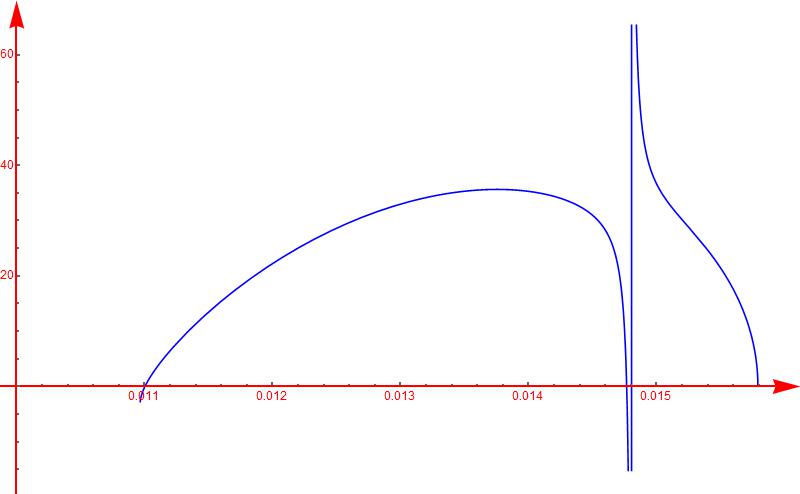
or it will look like shrinking version below:
What is the reason? How can I customize the axes style for my case?


